
Module 6 Unit 1 - Data Analysis#
Unit Learning Objectives#
By the end of this unit, you will be able to
Explain what data analysis and why it’s important
Understand how visualizations of data can impact our understanding
What is Data Analysis?#
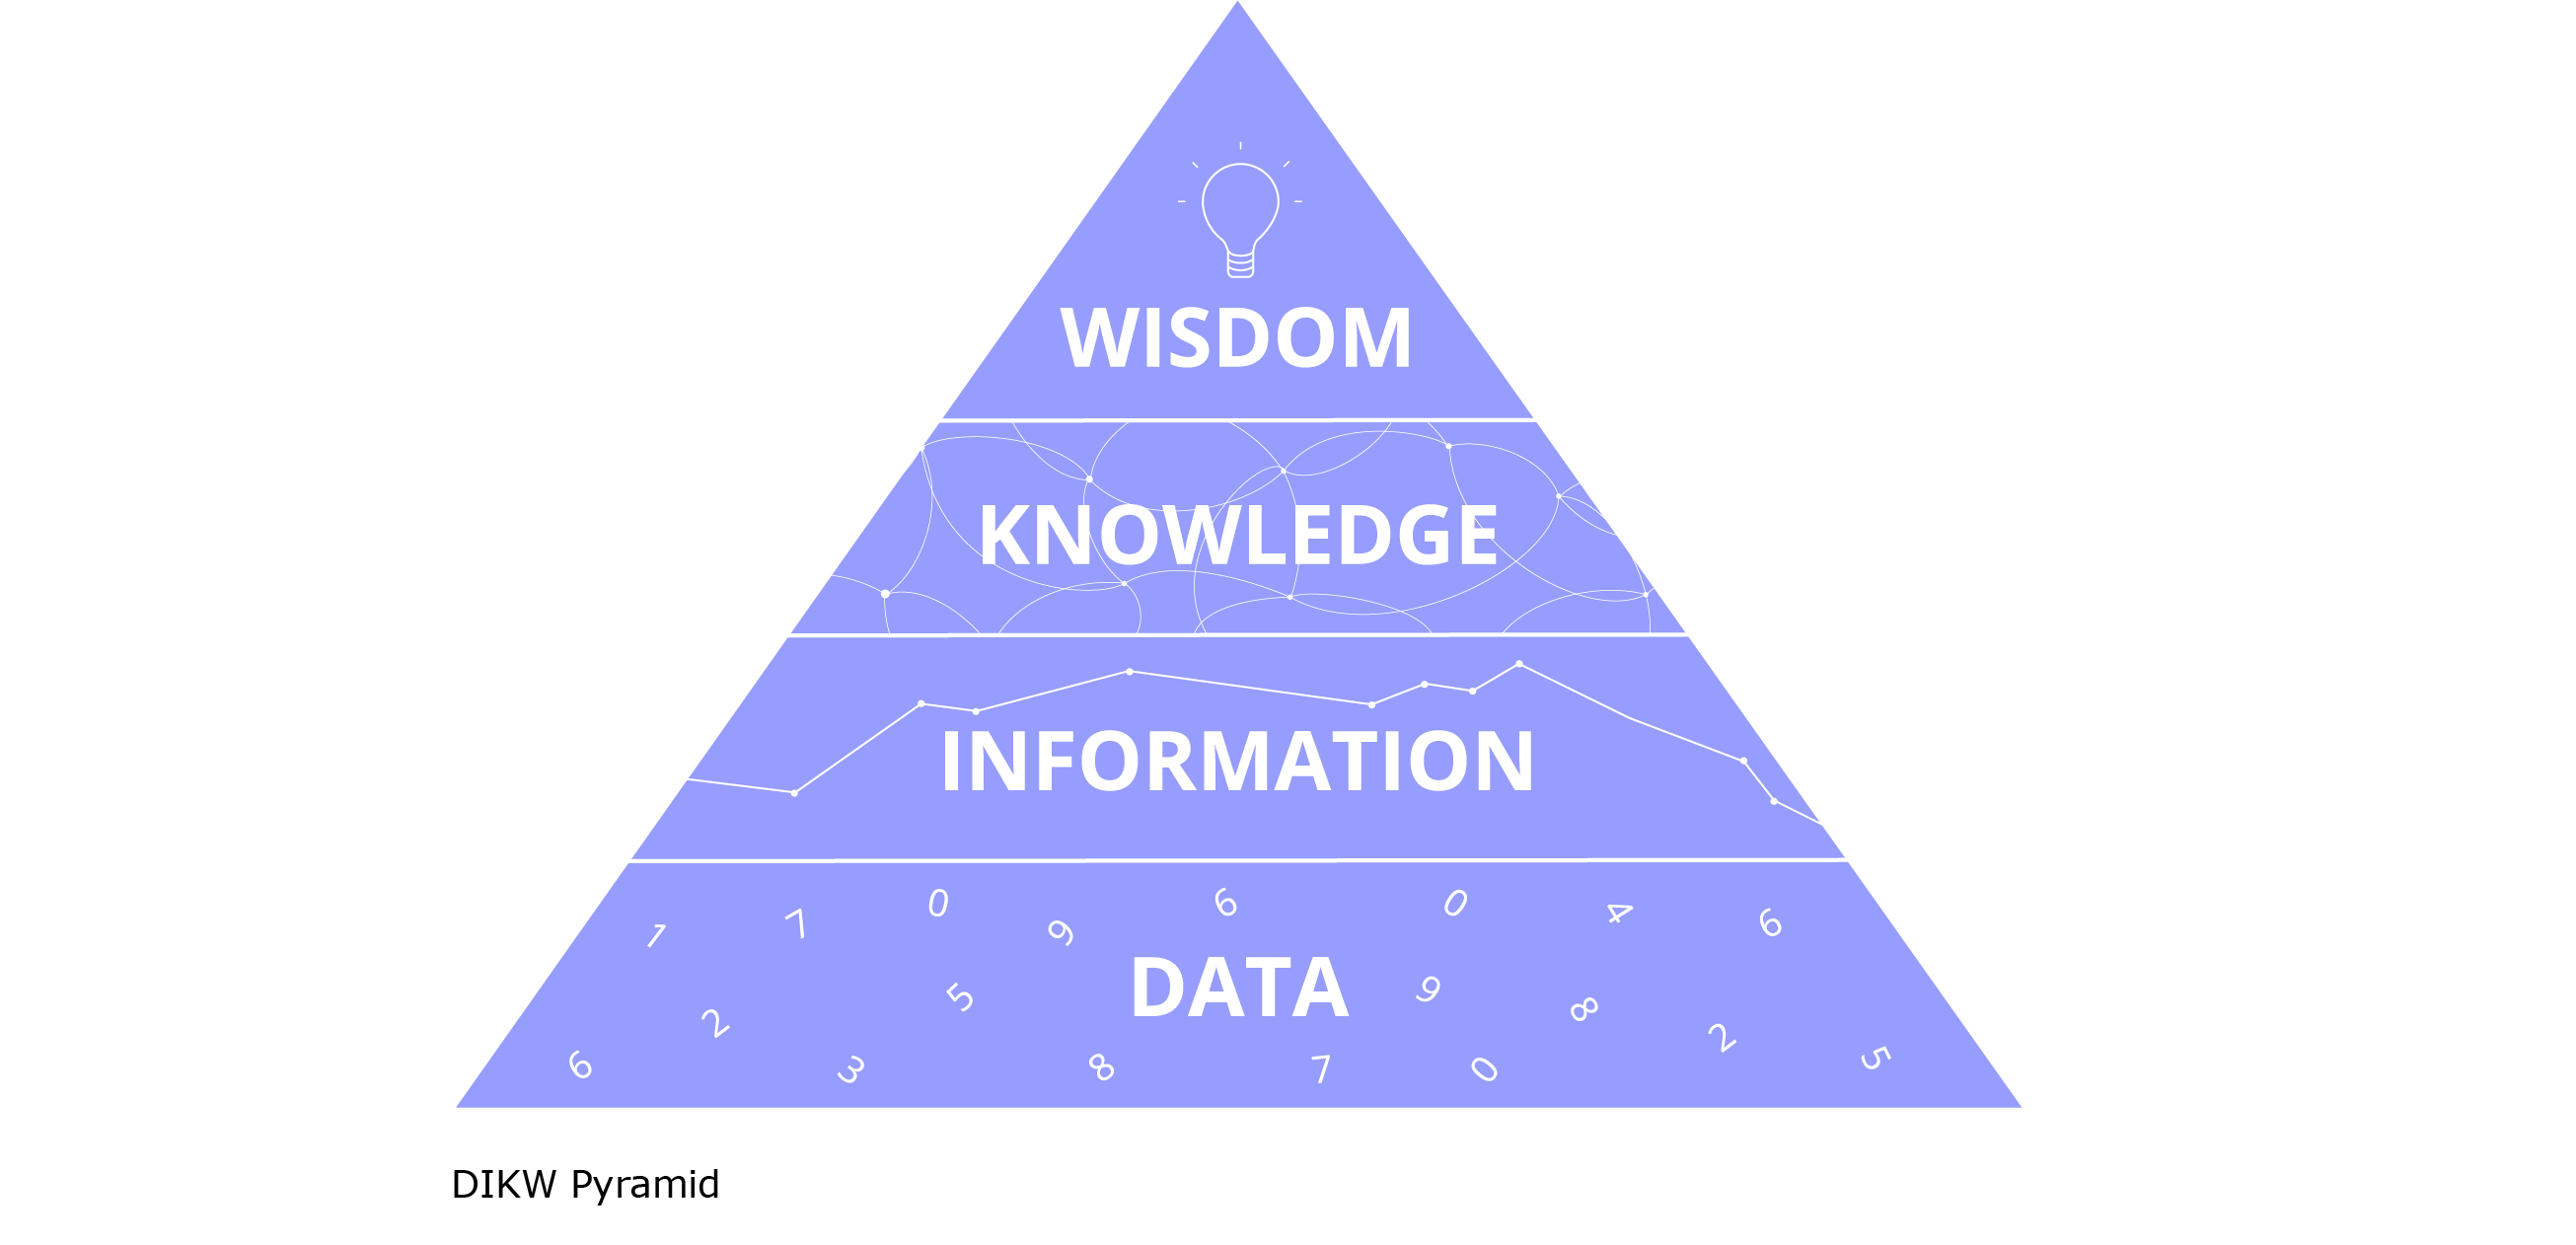
Data analysis is defined by Wikipedia to be “a [process] of working with data with the goal of discovering useful information, informing conclusions, and supporting decision-making.”
This process can be visualized as steps in a pyramid (known at the DIKW or data pyramid), where each step up the pyramid adds value in terms of insight from the initial raw data.
Being able to analyze data is an important component in data literacy. As this article about ideas discussed at the 2018 World Data Forum illustrates, data can not always be trusted, and even accurate data can still be misleading.
Data analysis enables students, teachers, and citizens to identify incorrect or misleading information and communicate more clearly. These skills are critical to making informed decisions throughout organizations in both public and private sectors.
A wide range of professions involve the frequent use of data analytics, examples include researchers, teachers, data scientists, and statisticians. People in these professions are employed in all manner of industries, including business, government, sciences, technology, and journalism.
The field of data science in particular is rapidly evolving and brings a scientific approach to analyzing data from new and growing sources, including open data, sensor data, and social media data. Using these new sources to data scientist are developing both predictive and prescriptive insights which can improve organizational efficiency, drive policy, and create better methods of decision-making. Professionals in this field tend to be inquisitive, have strong coding and software skills, and expertise in math and statistics.
The programming language of choice for many data scientists is Python.
from IPython.display import YouTubeVideo
YouTubeVideo('7yDmGnA8Hw0')
External Activity: Representing Data#
A key part in analyzing data is understanding how to represent it in ways that are clear and not misleading. Let’s explore this further using a Jupyter notebook.
Follow the steps below to add the Data Representation notebook to your Callysto hub.
Click this link to open the notebook in your Callysto Hub.
If you have any difficulty following the link, you can also search for the Data Representation notebook in Callysto’s learning module library at https://callysto.ca/learning_modules
As we learned in Module 4, any notebooks you open in Callysto are automatically added to your personal hub, allowing you to revisit and alter them if you wish.
After opening the notebook in Callysto, click Run All to view the learning module as it is intended to be displayed.
When displayed correctly, there shouldn’t be any large blocks of code.
Once you have opened and run the Data Representation notebook in Callysto, read through the content and follow any activity prompts to learn about different ways data can be visualized.
