

![]()
%%html

<script>
  function code_toggle() {
    if (code_shown){
      $('div.input').hide('500');
      $('#toggleButton').val('Show Code')
    } else {
      $('div.input').show('500');
      $('#toggleButton').val('Hide Code')
    }
    code_shown = !code_shown
  }

  $( document ).ready(function(){
    code_shown=false;
    $('div.input').hide()
  });
</script>
<p> Code is hidden for ease of viewing. Click the Show/Hide button to see. </>
<form action="javascript:code_toggle()"><input type="submit" id="toggleButton" value="Show Code"></form>
!pip install --upgrade --force-reinstall --user git+git://github.com/callysto/nbplus.git#egg=geogebra\&subdirectory=geogebra
Collecting geogebra
  Cloning git://github.com/callysto/nbplus.git to /tmp/pip-install-uac9m191/geogebra
Building wheels for collected packages: geogebra
  Building wheel for geogebra (setup.py) ... ?25ldone
?25h  Created wheel for geogebra: filename=geogebra-0.0.0-py3-none-any.whl size=6210 sha256=fad11e4e2db79070385ef43a9fff5cc5fe72eaeb5a6ed258197f56f0b7ab9a07
  Stored in directory: /tmp/pip-ephem-wheel-cache-6e42495v/wheels/a2/4f/cf/ee77bbaa35bfe141f46fc9f8153c9509b1535406d0d68b6086
Successfully built geogebra
Installing collected packages: geogebra
  Attempting uninstall: geogebra
    Found existing installation: geogebra 0.0.0
    Uninstalling geogebra-0.0.0:
      Successfully uninstalled geogebra-0.0.0
Successfully installed geogebra-0.0.0
import numpy as np
import matplotlib.mlab as mlab
import matplotlib.pyplot as plt
from ipywidgets import interact, widgets, Button, Layout

from scipy import stats
from collections import Counter
from array import array
import IPython
import pandas
from statistics import mean, median, mode

from IPython.display import HTML
import random
from IPython.display import IFrame
def display(question, answerList):
    print(question)
    IPython.display.display(answerList)
Central Tendancy: Mean, Median, and Mode
Grade 7 Statistics
This notebook will cover 3 important statistics: mean, median, and mode. These three statistics are known as the measures of central tendency because they tell us where data is centered or clustered together. It will also cover the topic of range. Here are a few questions this notebook will answer:
What is range?
What is mean?
What is median?
What is mode?
When do we use each of these statistics?
If you want a good summary of this topic, check out this website for Australian junior high students or watch the video at the end!
1. Definitions
What is range?
Given a set of values, the range is just the difference between the highest value and the lowest value. This quickly tells us if the values are spread apart or close together.
Example
The time it took Avery to walk to school each day this week was 10 minutes, 15 minutes, 12 minutes, 20 minutes, and 8 minutes. What is the range of the time it takes to walk to school?
range = highest value - lowest value
range = 20 minutes - 8 minutes
range = 12 minutes
Based on the value of the range, we know that the time it takes to walk to school can be quite different.
What is ‘mean’?
No, we don’t mean being rude to other people. A mean (sometimes called an average) of a set of numbers is the sum of all the values divided by the number of number of values.
Example 1
Here is a data set: \(2, 6, 3, 7, 5, 3, 9\)
Number of elements in this data set: \(7\)
So the mean is:
$\(\text{mean} = \frac{2 + 6 + 3 + 7 + 5 + 3 + 9}{7} = \frac{35}{7} = 5 \)$
Now these are just numbers, let’s see where the mean applies in real life.

Example 2
In Rose Middle School, there’s 3 classes of Grade 8 students. The first one has 25 students, the second has 18 students, and the third has 20 students. What is the average number of students in one class?
Remember that average is the same as mean
Our set of data is \((25, 18, 20)\) and there is \(3\) elements in this set. Now we can calculate the mean.
That means that Grade 8 students in Rose Middle School have an average of 21 students per class.
Picture from teachub.com
Try for yourself!
question612 = "What is the mean of the following numbers? \n 10, 91, 39, 71, 17,  39, 76, 37, 25"

answer612 = widgets.RadioButtons(options=['45', '45.11', '43.67', '46', 'None of the above'],
                             value=None, description='Choices:')

def check612(b):
    IPython.display.clear_output(wait=False)
    display(question612, answer612)
    if answer612.value == '45':
        print("Correct Answer!")
    else:
        print("Wrong answer! Try again.")

IPython.display.clear_output(wait=False)
display(question612, answer612)
answer612.observe(check612, 'value')
What is the mean of the following numbers?
 10, 91, 39, 71, 17,  39, 76, 37, 25
%%html
<html>
<head>
<script type="text/javascript">
<!--
function toggle(id) {
var e = document.getElementById(id);
if(e.style.display == 'none')
e.style.display = 'block';
else
e.style.display = 'none';
}
//-->
</script>
</head>

<body>
<div id="question612">
 <button id = "612"
onclick="toggle('answer612');">Solution</button>
</div>
<div style="display:none" id="answer612">
To find out the mean of semester 1 we divide the sum of all data by the numbers of data.<br/>
Therefore, Mean $=  \frac{10 + 91 +  39 + 71 + 17 +  39 + 76 + 37 + 25}{9} = 45$ <br/>


</div>

</body>
</html>
What is median?
Let’s play monkey in the middle!
The median is the middle number in a sequence of numbers.To compute the median, the set needs to be ordered from smallest to largest. Then it’s easy to find the middle number!

Example 1
Data set: \(2, 6, 3, 7, 5, 3, 9\)
Now if we sort the data set: \(2, 3, 3, 5, 6, 7, 9\)
So, median will be \(5\) because it’s 4 numbers in from both sides
Did you notice that this data set has an odd number of values? What is the problem if there’s an even number of values in a set? How can we figure out the median? We still want the middle number, so we can’t choose one closer to either the left or the right side. We can average the two numbers closest to the middle to get a true middle number for the whole set!
Example 2
Data set: \(2, 6, 3, 7, 5, 3, 9, 4 \)
Notice how there’s 8 values in this set
Sorted data set: \(2, 3, 3, 4, 5, 6, 7, 9\)
There two middle numbers are \(4\) and \(5\)
Therefore, the median will be \(\frac{(4+5)}{2} = 4.5\)
Picture from thegamegal.com
Try for yourself!
answer622 = widgets.RadioButtons(options=['11', '11.5', '12', '12.5', 'None of the above'],
                             value = None, description='Choices:')

question622 = "Suppose, the front row in your classroom has 23 seats. If you were asked to sit in the seat \n in the median position, in which seat would you have to sit?"


def check622(d):
    IPython.display.clear_output(wait=False)
    display(question622, answer622)
    if answer622.value == '12':
        print("Correct Answer!")
    else:
        print("Wrong answer! Try again.")

IPython.display.clear_output(wait=False)
display(question622,answer622 )
answer622.observe(check622, 'value')
Suppose, the front row in your classroom has 23 seats. If you were asked to sit in the seat
 in the median position, in which seat would you have to sit?
%%html
<html>
<head>
<script type="text/javascript">
<!--
function toggle(id) {
var e = document.getElementById(id);
if(e.style.display == 'none')
e.style.display = 'block';
else
e.style.display = 'none';
}
//-->
</script>
</head>

<body>
<div id="question622">
 <button id = "622"
onclick="toggle('answer622');">Solution</button>
</div>
<div style="display:none" id="answer622">
    <br/>
    The number of seats is odd (23). To find out the median of the seats we need to divide the total number of seats by 2 and we get 11.5. <br/>
    So, 12-th seat is in the median position in the first row. <br/>
    We can also think of it as the seat 12 has 11 seat on the left, and 11 seats on the right. <br/>
    So the correct answer is 12.<br/>

</div>

</body>
</html>
What is mode?
The mode for a data set is the element that occurs the most often.
It’s possible for a data set to have no modes, one mode, two modes (bimodal), or even three modes (trimodal)!
To find the mode, you don’t have to sort the set, but it is very helpful to sort it as the mode(s) will be where a number is repeated and that’s easier to see when they are next to each other.

Example 1
Data set: \(2, 6, 3, 7, 5, 3, 9\)
Sorted data set: \(2, 3, 3, 5, 6, 7, 9\)
Here, only the value \(3\) repeats and all other values only appear once.
So, mode will be \(3\).
Example 2
Data set: \(2, 6, 3, 7, 5, 3, 9, 5, 3, 5, 6 \)
Sorted data set: \(2, 3, 3, 3, 5, 5, 5, 6, 6, 7, 9\)
Values \(3\) and \(5\) have same number of repetitions.
Notice how \(6\) is also repeated but it is not as many times as \(3\) or \(5\) so it is not part of the mode.
So, the mode will be, \(3, 5\)
Example 3
Data set: \(2, 6, 3, 7, 5, 8, 9, 4 \)
Sorted data set: \(2, 3, 4, 5, 6, 7, 8, 9\)
There are no value that repeats.
So, there is no mode.
Picture from zooky world
Try for yourself!
A student recorded her scores on weekly math quizzes that were marked out of a possible 10 points. Her scores were as follows:
5, 6, 9, 8, 9, 10, 7, 6, 8, 7, 6, 7
answer641 = widgets.RadioButtons(options=['6', ' 7', '6 and 7', '8 and 9', 'None of the above'],
                              value=None,description='Choices:')

question641 = "What is/are the mode of her records?"


def checkAnswer641(f):
    IPython.display.clear_output(wait=False)
    display(question641, answer641 )
    if answer641.value == '6 and 7':
        print("Correct Answer!")
    else:
        print("Wrong answer! Try again.")

IPython.display.clear_output(wait=False)
display(question641, answer641)
answer641.observe(checkAnswer641, 'value')
What is/are the mode of her records?
%%html
<html>
<head>
<script type="text/javascript">
<!--
function toggle(id) {
var e = document.getElementById(id);
if(e.style.display == 'none')
e.style.display = 'block';
else
e.style.display = 'none';
}
//-->
</script>
</head>

<body>
<div id="question641">
 <button id = "641"
onclick="toggle('answer641');">Solution</button>
</div>
<div style="display:none" id="answer641">
At first, let sort the scores on weekly math quizzes: <br/>
    $ 5, 6, 6, 6, 7, 7, 7, 8, 8, 9, 9, 10$ <br/>
From the sorted points, we can imply, <br/>
5 only apears once, <br/>
    6 and 7 repeat three times, <br/>
    8 and 9 repeat two times, <br/>
    and 10 only appears once. <br/>
    Therefore, the mode of her scores are: 6 and 7 <br/>

</div>

</body>
</html>
2. Interactive bar graph
Now you can play with a bar graph and examine how to calculate mean, median, and mode by changing values of the dataset.
Instructions:
Step 1: enter how many data points you have in “Enter the numbers of the dataset.” Max of 10
based on your input in step 1, sliders will be available (one for each data point).
Step 2: change the value of sliders and see the associated changes in the bar graph.
Step 3: to show the breakdown for calculating mean check the box Mean, for median check Median and so on.
%%html
<iframe scrolling="no" title="CentralTendancy" src="https://www.geogebra.org/material/iframe/id/fnx4j7yg/width/1010/height/476/border/888888/sfsb/true/smb/false/stb/false/stbh/false/ai/false/asb/false/sri/false/rc/false/ld/false/sdz/false/ctl/false" width="1010px" height="476px" style="border:0px;"> </iframe>
Example Using A Large Dataset
We will be using a computer to calculate the mean, median, and mode for both the x and y values of this graph.
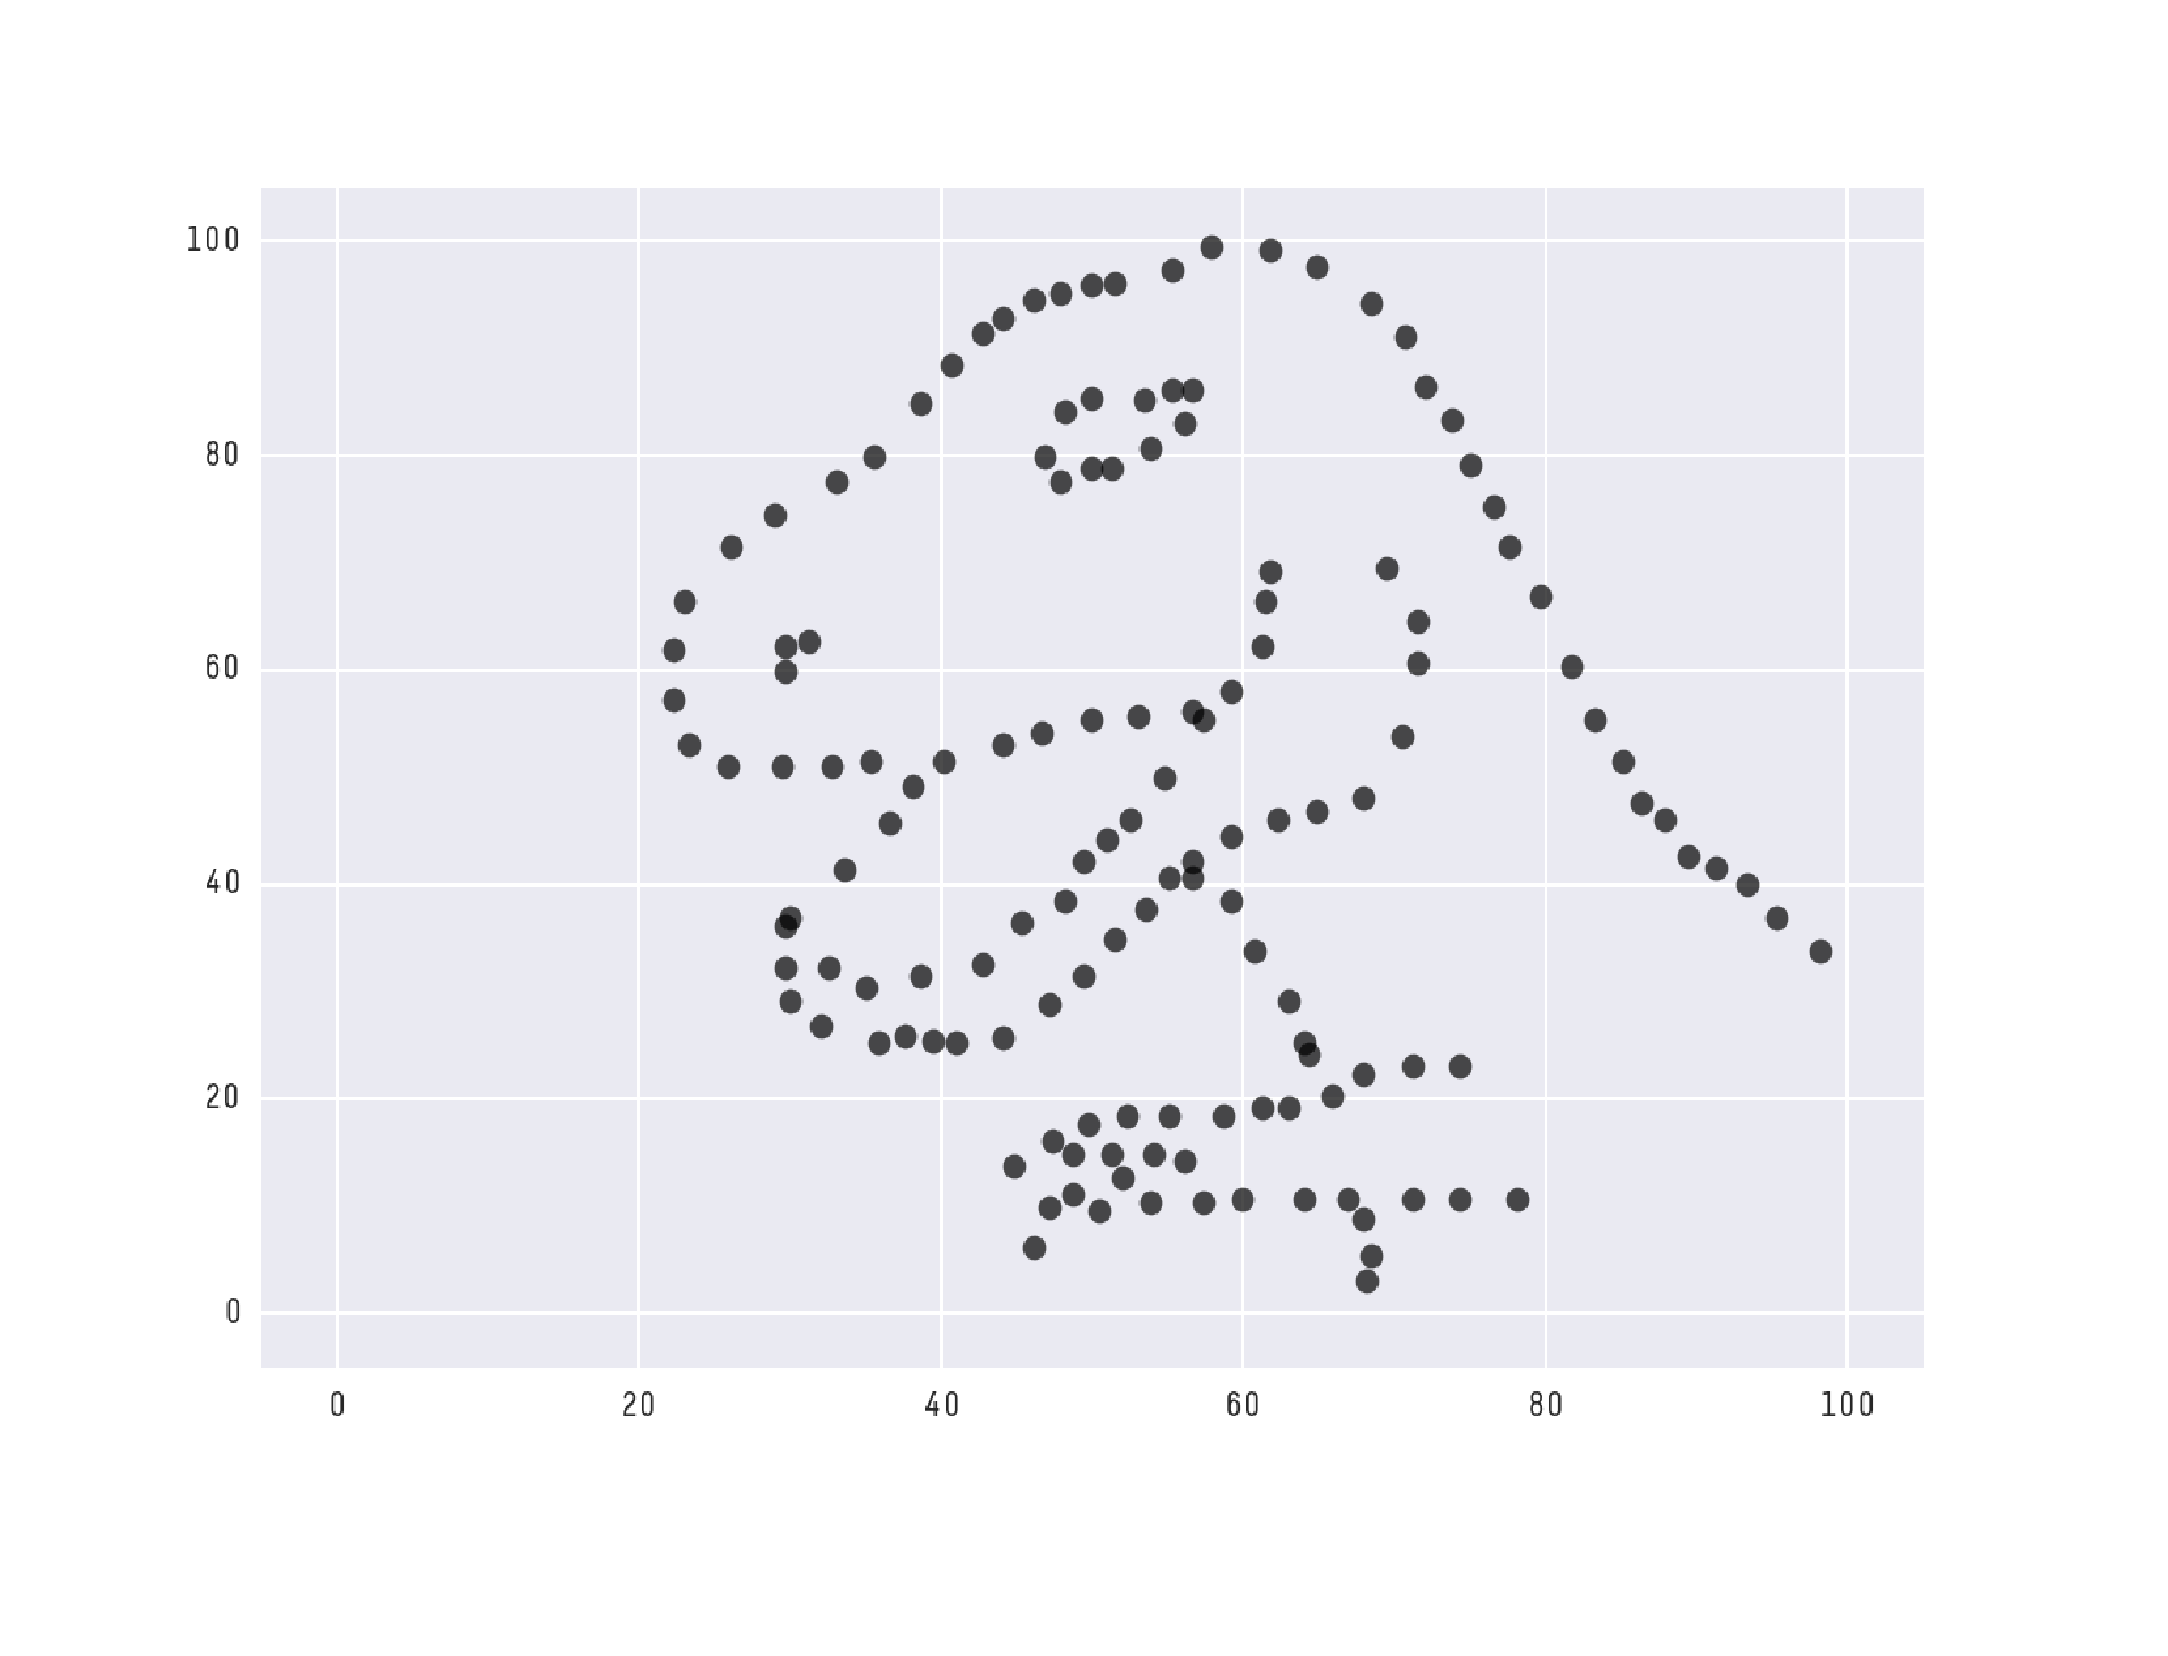
This dataset was originally created by Alberto Cairo which is named “Datasaurus” (for obvious reasons). It was made to show how we shouldn’t blindly trust only central tendency to tell the full picture of the data.
He also made this data free for everyone to use!
There are 142 values in this dataset! If you want to compute mean, median, or mode by hand, feel free to display the whole dataset using the button below.
dataset = pandas.read_csv("sources/Datasaurus.csv")
show = widgets.ToggleButton(value=False,description='Show dataset',disabled=False)

def display_data(a):
    if show.value == True:
        print(round(dataset.head(142),3))
    else:
        IPython.display.clear_output()
        IPython.display.display(show)

IPython.display.display(show)
show.observe(display_data, 'value')
Mean
#Mean
fullDataframeMean = []
fullDataframeMean = dataset.mean()
print(round(fullDataframeMean.head(2),3))
x    54.263
y    47.832
dtype: float64
What does this tell us?
We now know that the average of the x values is larger than 50 which means there are more dots on the right than the left. We also know the average of the y values is less than 50 which means there are more dots on the bottom than the top.
We can see this as the T-Rex is on the right of the graph and it took lots of dots to make the details of the claws and bottom jaw compared to the top of the head.
Median
#Median
fullDataframeMedian = []
fullDataframeMedian = dataset.median()
print(round(fullDataframeMedian.head(2),3))
x    53.333
y    46.026
dtype: float64
What does this tell us?
We now know what the middles values are so we can find the middle of the T-Rex at this location.
Mode
#Mode
fullDataFrameMode = []
fullDataFrameMode = dataset.mode()
print(round(fullDataFrameMode.head(1),3))
  dataset       x       y
0    dino  29.744  10.641
What does this tell us?
The mode tells us where to find the straightest line up and down by the x value and the straightest line left to right by the y value.
Autodesk Research used this dataset to create the “Datasaurus Dozen”. They created 12 new graphs with the same x and y mean as “Datasaurus”.
Create Your Own Data Set
You can click “Show/hide next box” and change the numbers in “YourDataSet”. You can even add new ones or take away some. Try making a set with small numbers and one with large numbers. Try to make sets with an even amount of numbers and an odd amount of numbers.
Just make sure there’s a comma ( , ) between each number.
Then we tell the computer to compute the mean, then the median, then the mode. It’s important to know how to calculate these by hand, but computers are very smart now. We have these tools to help us calculate things like mean, median, and mode once we understand what they mean.
After making your changes, to run the cell with code below click on the “Run” button at the top or hit “Ctrl+Enter/Return” key.
#found on https://stackoverflow.com/questions/31517194/how-to-hide-one-specific-cell-input-or-output-in-ipython-notebook

def hide_toggle():
    this_cell = """$('div.cell.code_cell.rendered.selected')"""

    toggle_text = 'Show/hide next box'  # text shown on toggle link

    target_cell = this_cell + '.next()'

    js_f_name = 'code_toggle_{}'.format(str(random.randint(1,2**64)))

    html = """
        <script>
            function {f_name}() {{
                {cell_selector}.find('div.input').toggle();
            }}

        </script>

        <a href="javascript:{f_name}()">{toggle_text}</a>
    """.format(
        f_name=js_f_name,
        cell_selector=target_cell,
        toggle_text=toggle_text
    )

    return HTML(html)
hide_toggle()
YourDataSet = [0,1,2,3,4,5,6] #don't forget a comma between each number!

#the word "print" tells the computer to write it below this block so you can read it!
print("Your mean is: ")
print(mean(YourDataSet)) #this calculates your mean
print("Your median is: ")
print(median(YourDataSet)) #this calculates your median
try:
    print("Your mode is: ")
    print(mode(YourDataSet)) #this calculates your mode
except:
    print("There is no mode in your data set") #this is incase there is no mode
Your mean is:
3
Your median is:
3
Your mode is:
There is no mode in your data set
Test yourself
Try out some of these harder questions on your own!
question611 = "What number would you divide by to calculate the mean of 3, 4, 5, and 6?"

answer611 = widgets.RadioButtons(options=['3', '4', '4.5', '5', 'None of the above'],
                             value= None, description='Choices:')


def checkAnswer(a):
    IPython.display.clear_output(wait=False)
    display(question611, answer611)
    if answer611.value == '4':
        print("Correct Answer!")
    else:
        print("Wrong answer! Try again.")

display(question611, answer611)

answer611.observe(checkAnswer, 'value')
What number would you divide by to calculate the mean of 3, 4, 5, and 6?
%%html
<html>
<head>
<script type="text/javascript">
<!--
function toggle(id) {
var e = document.getElementById(id);
if(e.style.display == 'none')
e.style.display = 'block';
else
e.style.display = 'none';
}
//-->
</script>
</head>

<body>
<div id="question611">
 <button id = "611"
onclick="toggle('answer611');">Solution</button>
</div>
<div style="display:none" id="answer611">
From the definition of mean, we know that we have to divide by the total number of elements in the data set.<br/>
In this case, that number is 4. <br/>
So, to compute the mean, we have to divide the sum of the data set by 4. <br/>

</div>

</body>
</html>
question621 = "The mean of four numbers is 71.5. If three of the numbers are 58, 76, and 88, what is the value of the fourth number?"

answer621 = widgets.RadioButtons(options=['62', '73.37', '64', '74',  'None of the above'],
                              value = None, description='Choices:')

def check621(c):
    IPython.display.clear_output(wait=False)
    display(question621, answer621)
    if answer621.value == '64':
        print("Correct Answer!")
    else:
        print("Wrong answer! Try again.")

IPython.display.clear_output(wait=False)
display(question621, answer621)
answer621.observe(check621, 'value')
The mean of four numbers is 71.5. If three of the numbers are 58, 76, and 88, what is the value of the fourth number?
%%html
<html>
<head>
<script type="text/javascript">
<!--
function toggle(id) {
var e = document.getElementById(id);
if(e.style.display == 'none')
e.style.display = 'block';
else
e.style.display = 'none';
}
//-->
</script>
</head>

<body>
<div id="question621">
 <button id = "621"
onclick="toggle('answer621');">Solution</button>
</div>
<div style="display:none" id="answer621">
We are given three numbers but told the mean of four numbers is 71.5. Let assume the fourth number is x. <br/>
So, by the definition of mean, we can write <br>
$\frac{58 + 76 + 88 + x}{4} = 71.5 $ <br/>

or, $222 + x = 71.5 \times 4 $ <br/>

or, $x = 286 - 222 $ <br/>

or, $x = 64 $ <br/>

Therefore, the fourth number is 64. <br/>


</div>

</body>
</html>
Sara tried to compute the mean average of her 8 test scores. She mistakenly divided the correct sum of all her test scores by 7, which yields 96.
answer631 = widgets.RadioButtons(options=['78', '83.5', '100', '84', 'None of the above'],
                             value = None, description='Choices:')

question631 = "What is Sara's mean test score? (Source: dummies)"

def check631(e):
    IPython.display.clear_output(wait=False)
    display(question631, answer631)
    if answer631.value == '84':
        print("Correct Answer!")
    else:
        print("Wrong answer! Try again.")

IPython.display.clear_output(wait=False)
display(question631, answer631)
answer631.observe(check631, 'value')
What is Sara's mean test score? (Source: dummies)
%%html
<html>
<head>
<script type="text/javascript">
<!--
function toggle(id) {
var e = document.getElementById(id);
if(e.style.display == 'none')
e.style.display = 'block';
else
e.style.display = 'none';
}
//-->
</script>
</head>

<body>
<div id="question631">
 <button id = "631"
onclick="toggle('answer631');">Solution</button>
</div>
<div style="display:none" id="answer631">
You know the test score mean of Sara when divided by 7, you can determine the sum of her scores. This information will then allow you
to determine her mean average over eight tests.<br/>

Apply the average formula to her wrong calculation. <br/>

96 = sum of scores ÷ 7 <br/>

96 × 7 = sum of scores <br/>

672 = sum of scores <br/>

Now that you know her test score sum, you can figure her true mean average.<br/>

Mean average = 672 ÷ 8 <br/>

Mean average = 84 <br/>

So, the correct answer is D. <br/>

</div>

</body>
</html>
answer632 = widgets.RadioButtons(options=['32, 34, 35, 36', '32, 35, 36, 41', '32, 34, 40, 44', '32, 32, 38, 38', 'None of the above'],
                             value = None, description='Choices:')

question632 = "A set of four numbers that begins with the number 32 is arranged from smallest to largest.\n If the median is 35, which of the following could be the set of numbers?"

def check632(e):
    IPython.display.clear_output(wait=False)
    display(question632, answer632)
    if answer632.value == '32, 32, 38, 38':
        print("Correct Answer!")
    else:
        print("Wrong answer! Try again.")

IPython.display.clear_output(wait=False)
display(question632, answer632)
answer632.observe(check632, 'value')
A set of four numbers that begins with the number 32 is arranged from smallest to largest.
 If the median is 35, which of the following could be the set of numbers?
%%html
<html>
<head>
<script type="text/javascript">
<!--
function toggle(id) {
var e = document.getElementById(id);
if(e.style.display == 'none')
e.style.display = 'block';
else
e.style.display = 'none';
}
//-->
</script>
</head>

<body>
<div id="question632">
 <button id = "632"
onclick="toggle('answer632');">Solution</button>
</div>
<div style="display:none" id="answer632">
We are given the median of four numbers 35. We can imply from the given information is that the sum <br/>
of the numbers is 140. Now we check all the choices one by one. We add all the numbers of the first choice and get 137. <br/>
So it is not our correct answer. <br/>
Similarly, for the next choices we get 144, 150, and 140 for second, third and fourth choices, respectively, <br/>
Therefore, the correct series is: 32, 32, 38, 38.<br/>

</div>

</body>
</html>
answer642 = widgets.RadioButtons(options=['1', '2', '4', '19', 'None of the above'],
                             value = None,  description='Choices:')

question642 = "The average of five positive integers is less than 20. What is the smallest possible median of this set?"

def check642(g):
    IPython.display.clear_output(wait=False)
    display(question642, answer642)
    if answer642.value == '1':
        print("Correct Answer!")
    else:
        print("Wrong answer! Try again.")

IPython.display.clear_output(wait=False)
display(question642, answer642)
answer642.observe(check642, 'value')
The average of five positive integers is less than 20. What is the smallest possible median of this set?
%%html
<html>
<head>
<script type="text/javascript">
<!--
function toggle(id) {
var e = document.getElementById(id);
if(e.style.display == 'none')
e.style.display = 'block';
else
e.style.display = 'none';
}
//-->
</script>
</head>

<body>
<div id="question642">
 <button id = "642"
onclick="toggle('answer642');">Solution</button>
</div>
<div style="display:none" id="answer642">
As we are given that the numbers are positive integers that means all numbers should be
<br/>greater than or equal 1. Let assume the five numbers are 1, 1, 1, 1, 16. The sum is equal
<br/>to 20, and the average is 20/5 = 4 which is less than 20. All given conditions are satisfied.
<br > <b>Therefore, the smallest possible median is 1. <b> <br/>

</div>

</body>
</html>
Let’s summarize what we have learned in this notebook:
Mean is the average and is found by adding all values then dividing my the quantity of values
Median is the middle value and is found by sorting the set and finding the middle
Mode is the most used value and is found by counting how many times a value is repeated
Range is the highest value minus the lowest value
Here is a video made by Dylan Peters EDU that is a parody of the song Lazy Song by Bruno Mars that sums up these 4 concepts.
IFrame(width="560", height="315", src="https://www.youtube.com/embed/IHginNwss5c", allow="accelerometer; encrypted-media; gyroscope; picture-in-picture; allowfullscreen")
