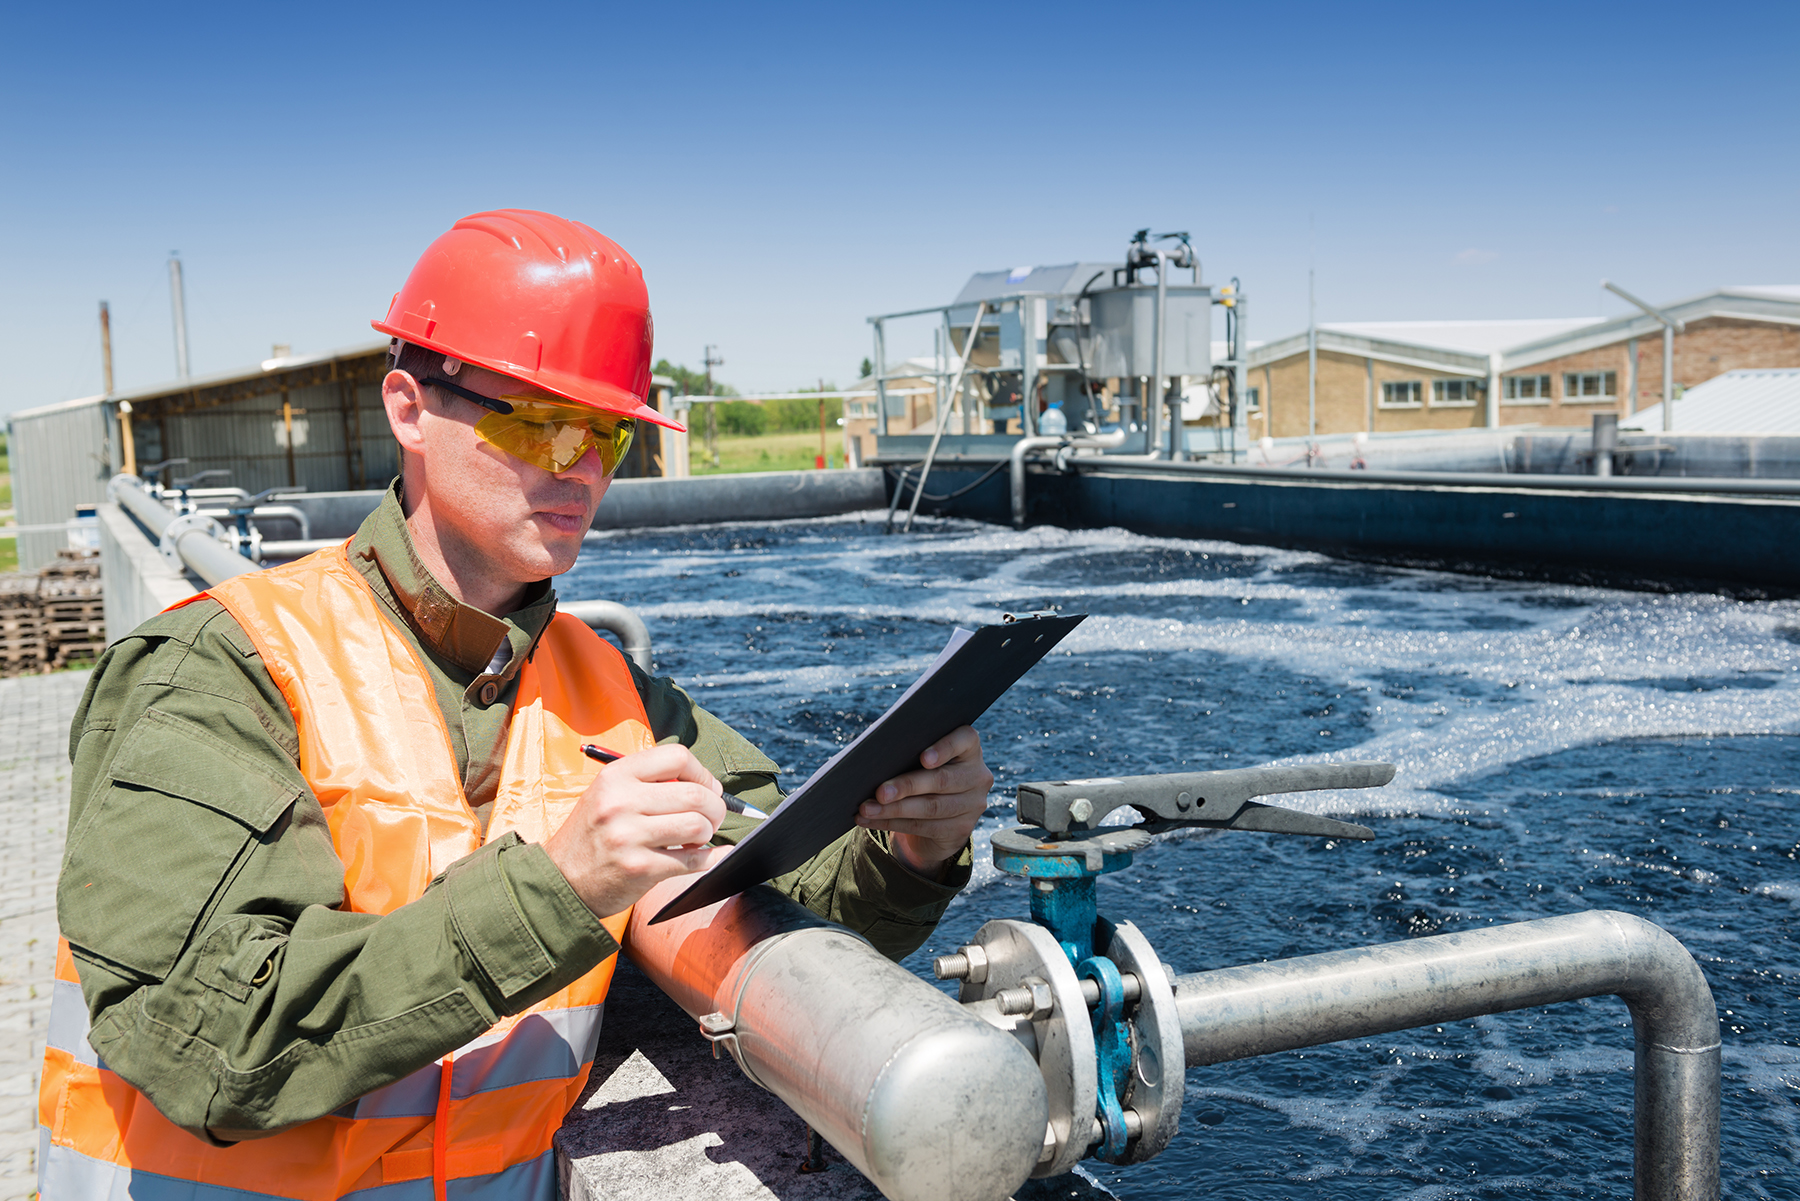

Electrical Conductivity
Based on LibreTexts library experiment titled “Electical Conductivity of Aqueous Solutions” published under a Creative Commons Attribution-NonCommercial-ShareAlike license.
Background
Electrical conductivity is based on the flow of electrons. Metals are good conductors of electricity because they allow electrons to flow through the entire piece of material. In comparison, distilled water is a very poor conductor of electricity since very little electricity flows through it. Dissolving ions in water changes this and allows electrons to travel through the solution. If the solution is able to conduct electricity, the current can be measured with a conductivity meter.
The Question
How does the conductivity of different solutions compare?
The Hypothesis
Enter your hypothesis by double clicking this text.
Materials & Equipment
conductivity meter
wash bottle with distilled water
large beaker for rinsing/waste
sodium chloride
sugar
tissues
Solutions:
acetic acid (vinegar)
tap water
Procedure
Use a wash bottle with distilled water and a large beaker labeled “waste” to rinse the electrodes. Dry using a tissue. When switched on, the meter should report 0 (or very close to it).
Put 50 mL of distilled water into a beaker.
Place the metal tips of your conductivity tester in the solution.
Record the conductivity reading of the distilled water in the table below.
Repeat steps 1-4 with samples of the other solutions. For example, take a spoonful of salt and dissolve it in water. After each conductivity measurement, empty the beaker and rinse it with distilled water.
Clean up when done.
Select the following code cell, then click the ▶Run button to display a data table for recording your observations. If you get an error, then remove the # from the first line of code and run it again. Double-click on the nan values to put in your own observations.
#!pip install qgrid --user --upgrade
import pandas as pd
import numpy as np
import qgrid
rows = ['Distilled Water', 'Tap Water', 'Salt Water', 'Vinegar']
columns = ['Reading 1', 'Reading 2', 'Notes']
df = pd.DataFrame(index=rows, columns=columns)
data_entry_table = qgrid.QgridWidget(df=df, show_toolbar=True)
data_entry_table
After you have recorded your observations in the table above, ▶Run the next cell to save and display your data.
data = data_entry_table.get_changed_df()
data['Average'] = (data['Reading 1'].astype(int)+data['Reading 1'].astype(int))/1
data
| Reading 1 | Reading 2 | Notes | Average | |
|---|---|---|---|---|
| Distilled Water | 1 | 2 | NaN | 2.0 |
| Tap Water | 3 | 4 | NaN | 6.0 |
| Salt Water | 5 | 6 | NaN | 10.0 |
| Vinegar | 7 | NaN | NaN | 14.0 |
Questions
Why must the conductivity electrodes and all the beakers be rinsed with distilled water after each conductivity test?
Which solution conducted electricity the best? How can you tell?
Why do you think different solutions conduct electricity differently?
Comparing to Water Treatment Plants
▶Run the next cell to download data from two water treatment plants, Rossdale and E.L. Smith, for the last week and graph the water conductivity as it compares to your data.
rossdale = pd.read_html('http://apps.epcor.ca/DailyWaterQuality/Default.aspx?zone=Rossdale', header=0)[0]
els = pd.read_html('http://apps.epcor.ca/DailyWaterQuality/Default.aspx?zone=ELS', header=0)[0]
import cufflinks as cf
cf.go_offline()
combined_data = pd.DataFrame()
combined_data['Rossdale'] = rossdale.iloc[6][1:]
combined_data['ELS'] = els.iloc[6][1:]
for i, row in data.iterrows():
    combined_data[row.name] = row['Average']
combined_data.iplot(yTitle='Conductivity (yS/cm)', title='Conductivity of Solutions Compared to Water Treatment Plant Data')

