
Module 1 Unit 1 - What is Data Science?#
Welcome to Callysto’s Data Science in Your Classroom#
As technology has advanced, data has become easier to collect, store, and access.
from IPython.display import YouTubeVideo
YouTubeVideo('soXsGmAIwuE')
🏷️ Key Term: Data#
By data we mean units of information collected through observation. It can be quantitative, such as the total number pizzas delivered in a night, or qualitative, such as the kinds of pizza toppings available.
Today, humanity is generating a lot of data, and doing it faster than ever. In fact, a significant fraction of all the data we’ve ever created was likely created in the past year.
Understanding and making use of this huge amount of information is a challenge, but the rewards for doing so can be great. Insights from data can help us make decisions, reveal problems and potential solutions, recognize trends, and prepare for the future.
🎥 Watch#
This 11-minute video provides a compact overview of the history of big data and how it impacts our lives today, and is a potentially useful class resource.Intro to Big Data: Crash Course Statistics
from IPython.display import YouTubeVideo
YouTubeVideo('v=vku2Bw7Vkfs')
Because of this, there’s a growing demand for data science skills—analyzing, interpreting, and problem-solving using data. In 2019, the job search website Indeed.com reported that data science job postings had more than tripled in the previous five years.
📚 Read#
While professional Data Scientists often have a significant amount of post-secondary education in fields such as mathematics or computing, most people can apply data science methods with only:
Some knowledge about the subject you are exploring
A basic understanding of statistics
Basic programming skills
This course will help you with 2 and 3.
Let’s get started!
📝 A note about grammar#
You may have seen the term data used in different ways.
In some dictionaries and academic writing, data is the plural form of the word datum which refers to a single value or observation. For example “I need one more datum” and “these data are correct.”
However, most people use the word data as a singular mass noun, the same way we do with the word water. As in “the data needs to be cleaned” or “I don’t have enough data.”
Both actually are correct, however, for consistency we’ll stick with the more common singular usage in this course.
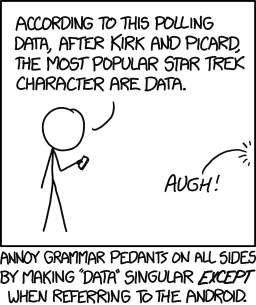
“Data” by XKCD is licensed under CC BY-NC 2.5
🎧 Listen#
A more detailed explanation of both usages is broken down in this short summary from Grammar Girl: Is “Data” Singular or Plural
from IPython.display import YouTubeVideo
YouTubeVideo('UdheLNlk5yc')
What is data science?#
As of May 2020, Wikipedia defined data science as
“…an interdisciplinary field that uses scientific methods, processes, algorithms and systems to extract knowledge and insights from many structural and unstructured data.”
In other words, data science is the practice of getting something useful from data.
Data science practice can be roughly broken into five stages:
Determine the question
Obtain the data
Clean the data
Analyze the data
Communicate the conclusions of the analysis
Each stage comes with its own challenges, and it’s not unusual in a data science project for a stage to be revisited several times.
Stages of Data Science#
Frame the question#
You may start with a question to be answered, or the questions may arise once you start looking at the data.
Obtain data#
Data scientists often work with existing data, but sometimes data may need to be collected via measurements, surveys or other methods such as meta-analysis. Existing data may also need to be labelled or combined. Data may be quantitative (numbers) or qualitative (descriptive).
Clean the data#
Once a data set has been collected, it often needs to be cleaned. This usually involves fixing or removing inaccurate values, addressing gaps, and sometimes rearranging or grouping related observations to make the data set easier to work with. Data scientists prefer tidy data, where values in the data set are arranged so that each row represents an observation and each column a value that relates to that of that observation.
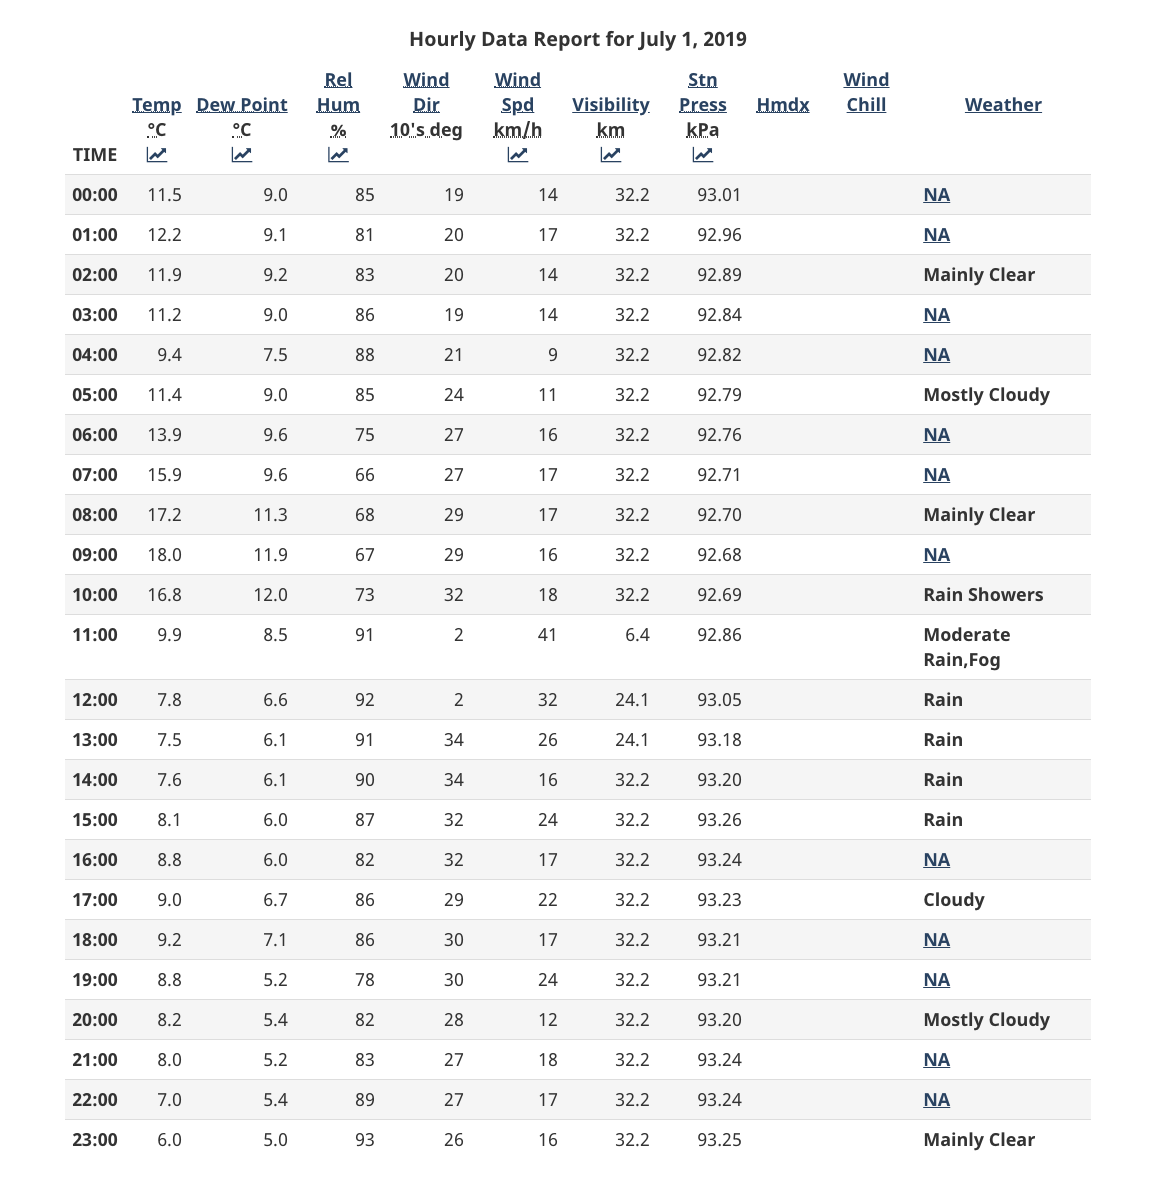
Hourly weather report in Edmonton on July 1, 2019 from Environment Canada
Hourly weather report in Edmonton, Alberta from July 1, 2019, to show an example of “tidy data.” There are 11 columns which show weather variables: time, temperature, dew point, relative humidity, wind speed, visibility, pressure, humidity index, and weather. The rows show observations from each colum variable.
For example, this data from Environment Canada shows weather data for Edmonton, AB, on July 1, 2019. Each row are different observations, each column is a different variable, and each observation has values for the different variables.
If we look closely, we can see there are many missing values (in the Hmdx and Wind Chill columns), as well as values that seem counterintuitive, like NA in the Weather column.
Analyze the data#
Data that is clean and tidy can be analyzed. This means examining it methodically and in detail so we can describe what has happened, diagnose why that happened and prescribe a course of action that will affect future outcomes. Since we’re just starting out with data science, this course focuses on describing data.
Communicate the results#
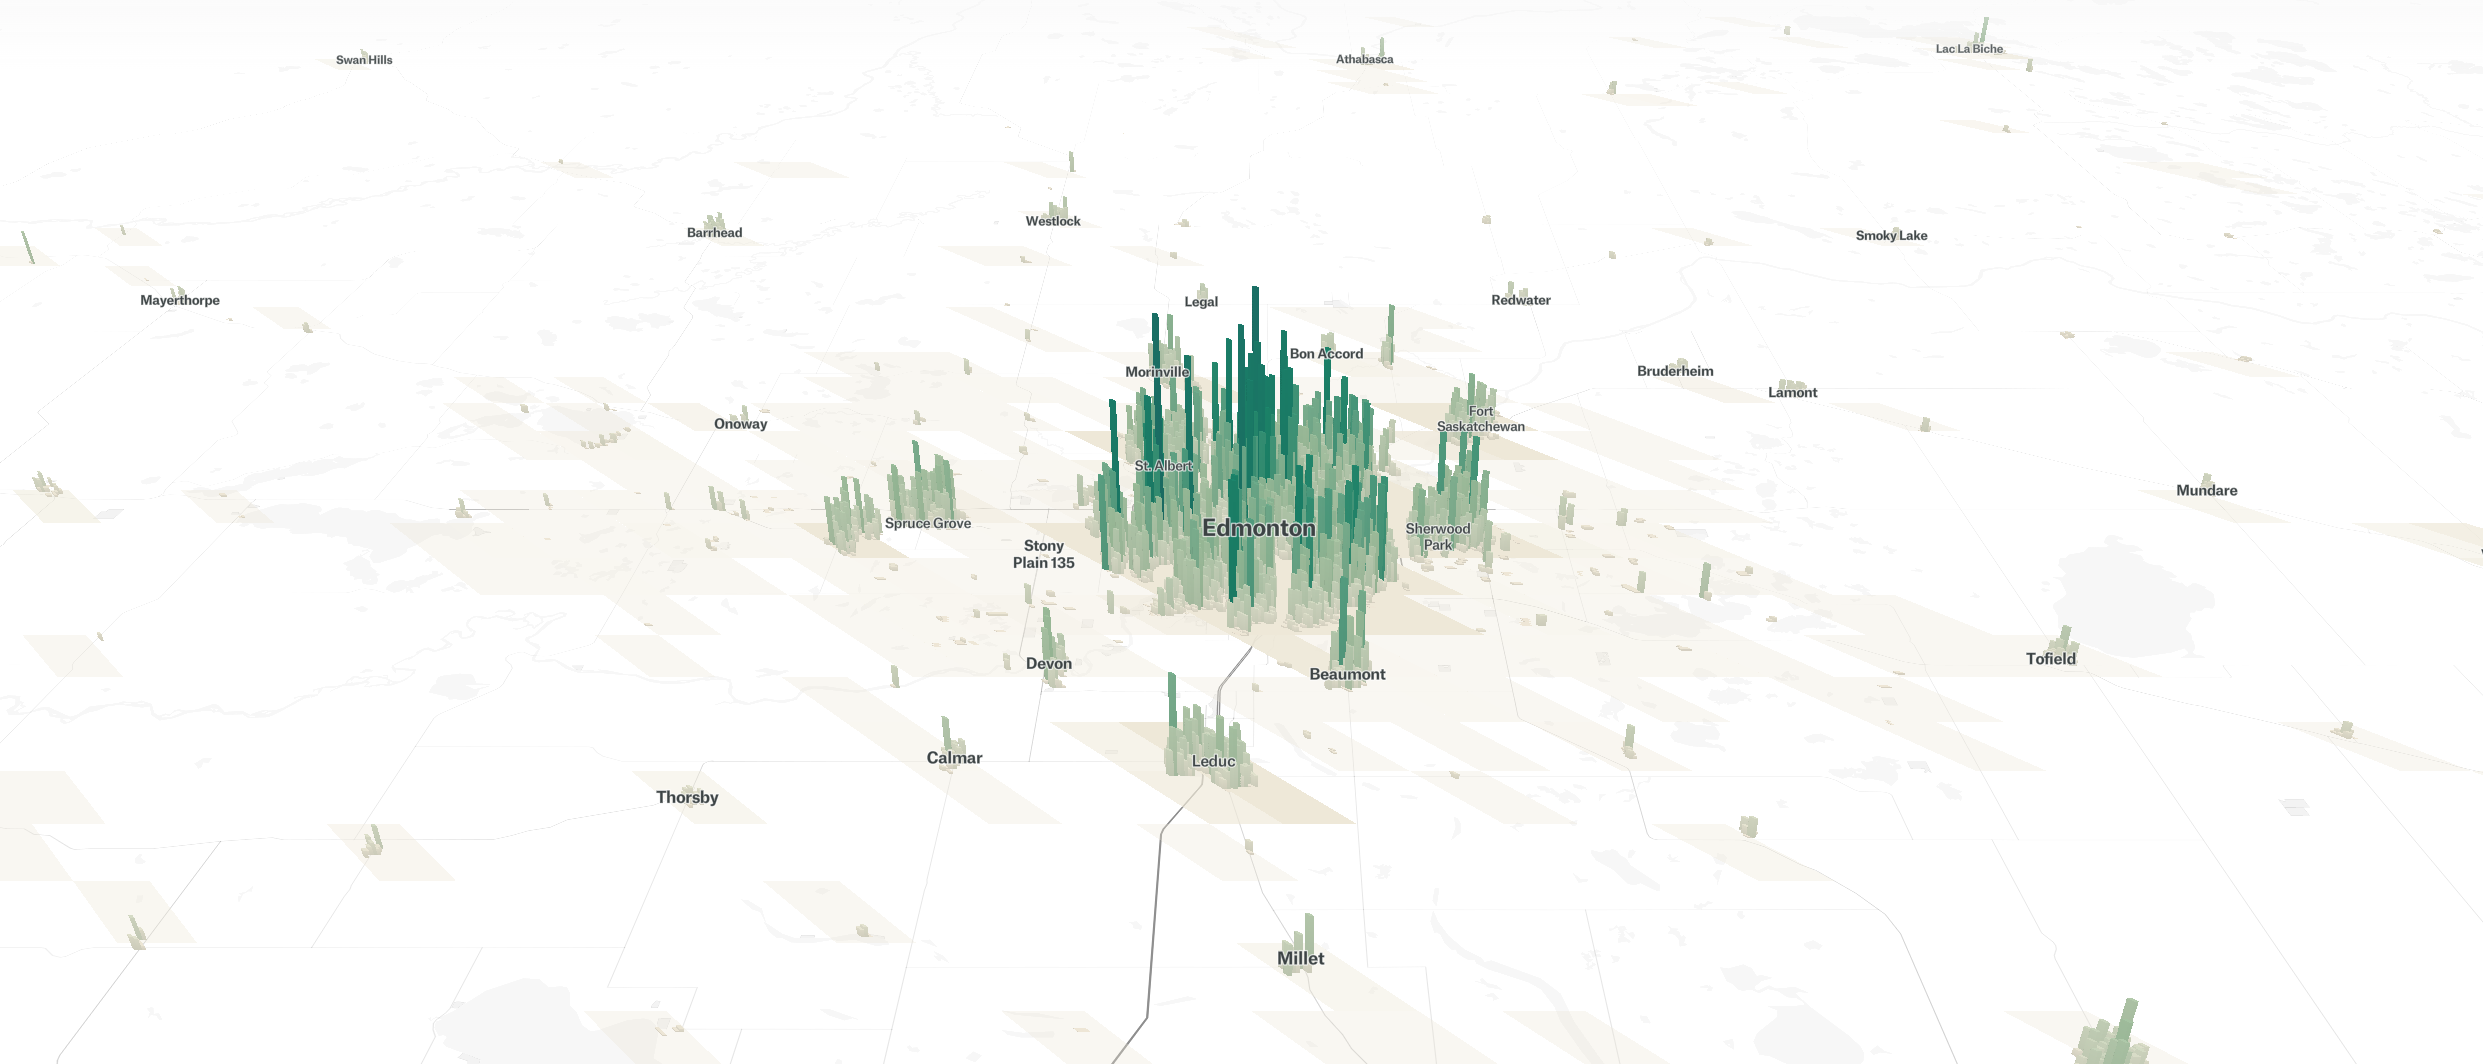
An example of data science in action is the Human Terrain project from Pudding.cool. City population numbers are not difficult to come by, but even with all this data at our fingertips it is challenging to grasp the scale of how many people these numbers represent and how they have changed over time.
The project presents population numbers as vertical bars overlaid on a 3D map of the region. This data visualization shows both current populations and past populations and allows us to gain new insight into both the density of areas and how they have changed over time.
🏷️ Key Term: Data Visualization#
A visual representation of data, such as a graph, chart or map, can help us see trends and relationships in data. We’ll explore different types of data visualizations and how to create them later in this course.
Data sets, such as the ones used in the Human Terrain project, are often very large. However we can also apply data science practices to small data sets, such as student ages in a class.
Data science tools#
Python#
This course will use Python, a popular programming language that is often used for data science.
Many data science tasks are best done with computer code. For example, if you had a large and messy data set you could write code to help you remove duplicate entries or convert values entered as written words into numbers.

Jupyter notebooks#
Since we’ll be working with code, we’ll need software that can run it. A Jupyter notebook is an open-source web application that allows you to create and share documents that contain live code, equations, visualizations, and regular written text.

We’ll create, store, and share these documents on a Jupyter Hub provided by the Callysto project: hub.callysto.ca. From now on we will refer to this as the Callysto Hub.
Jupyter notebooks aren’t the only way to do data science, but they’re great for use in a classroom for several reasons:
They allow for literate programming—written instructions, descriptions, and notes can be included in the same document as live code.
No software needs to be downloaded or installed.
They can be accessed and run from any type of computer, or even a tablet or smartphone.
🏁 Activity#
Check out this example of data science:
Conclusion#
Humanity is producing more data than ever before, and data science skills are increasingly relevant as a means to make sense of all this information.
Programming languages, like Python, and analysis and communication applications, such as Jupyter notebooks, are excellent tools for learning and applying data science techniques in a class setting.
In the next unit, we’ll dive deeper into the real-world utility of data science and how it’s being applied today.
💭 Have Questions?#
Click the Help button at the top right of the course to view our FAQ!
Topics include:
Navigating the Callysto Hub
Using Jupyter Notebooks
Coding
The Callysto Project
You might also wish to bookmark the FAQ page for easy reference as you work through exercises or as a reference when using these tools in the future!
