Module 2 Unit 2 - Data Fundamentals#
Data and information#
We often hear the terms data and information used interchangeably. This works fine in most everyday conversations, but in a data science context, it helps to be more specific.
In this course, data refers to specific pieces of information—facts, figures, or values that relate to specific observations. These pieces only become information when they are collected together and given structure and context to make them useful.
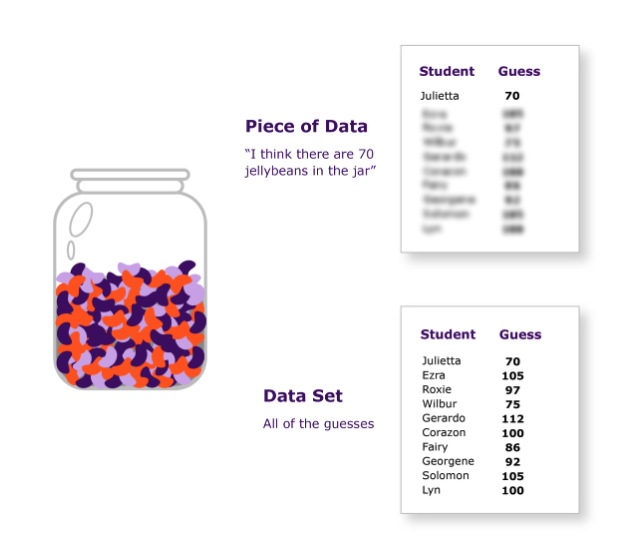
For example, if students were asked to guess the number of jelly beans in a jar, each person’s guess would be one piece of data.
However, if we were to collect all the guesses and calculate the average, the result would be information we derived from the data.
An organized collection of data is known as a data set. A spreadsheet that lists every student and their jelly bean jar guess would be an example of a data set.

Primary and secondary data#
There are two main ways to acquire data for a project:
Collect it new ourselves (primary data)
Reuse data collected by someone else (secondary data)
Primary Data
Data that is new and collected by researchers for a specific purpose is primary data. We decide what data we need and determine how we’re going to gather the data (i.e. a survey). An example of primary data would be the results of the 2016 Census of Population, collected by Statistics Canada. Other less typical sources of primary data include original social media posts, blogs, images, videos, and even personal diaries. The advantages of collecting primary data include: Getting the exact data you want, by designing your own data-collection process Verifying the data yourself The main disadvantage of primary data is the time and resources it takes to design the data-collection process and analyze the data.
Secondary Data
Data that is collected by another source is known as secondary data. For example, a local municipal government might use census data to look for changes in population. This could help them decide whether to approve new housing developments or public transit projects.
The advantages of using secondary data include:
Reducing the time to collect data
Reducing the cost to collect data
The disadvantages of using secondary data include:
The data not answering all the questions you need to cover
The lack of control over the quality of the data collected
As we learned in the last module, there is a lot of pre-existing data available to us and more is being generated all the time. Because of this, our main focus will be on working with secondary data.
🏁 Actvity#
Classify the data sources below as either primary or secondary.
Qualitative and Quantitative data#
*Qualitative Data
Also known as categorical, or nominal data, qualitative data takes the form of categories based on groupings, labels, attributes, properties, and other identifiers.For example, data regarding the gender identities of survey participants, their favourite pizza toppings, or the colours of their shoes is qualitative data. Qualitative data can sometimes have a numerical value (e.g. social insurance number) if they are unique to an individual.Qualitative data can sometimes have an order where the numerical position of an object can be described. For example, there is a conventional order to the colours in a rainbow.
*Quantitative Data
Quantitative data is measurable and varies in magnitude. For example, the total number of people who replied to a survey, the number of pizzas they have eaten this month, and their shoe sizes are examples of quantitative data. Quantitative data is always expressed in the form of numbers. These numbers can be discrete (meaning whole round numbers) or continuous, with floating point values and many decimal places.
🏁 Actvity#
True and False questions
Big data#
One of the exciting things about modern data science tools and techniques is how they let us work with big data.
Big data is a collection of observations that are too large or complex to be effectively analyzed by traditional data processing software and methods.
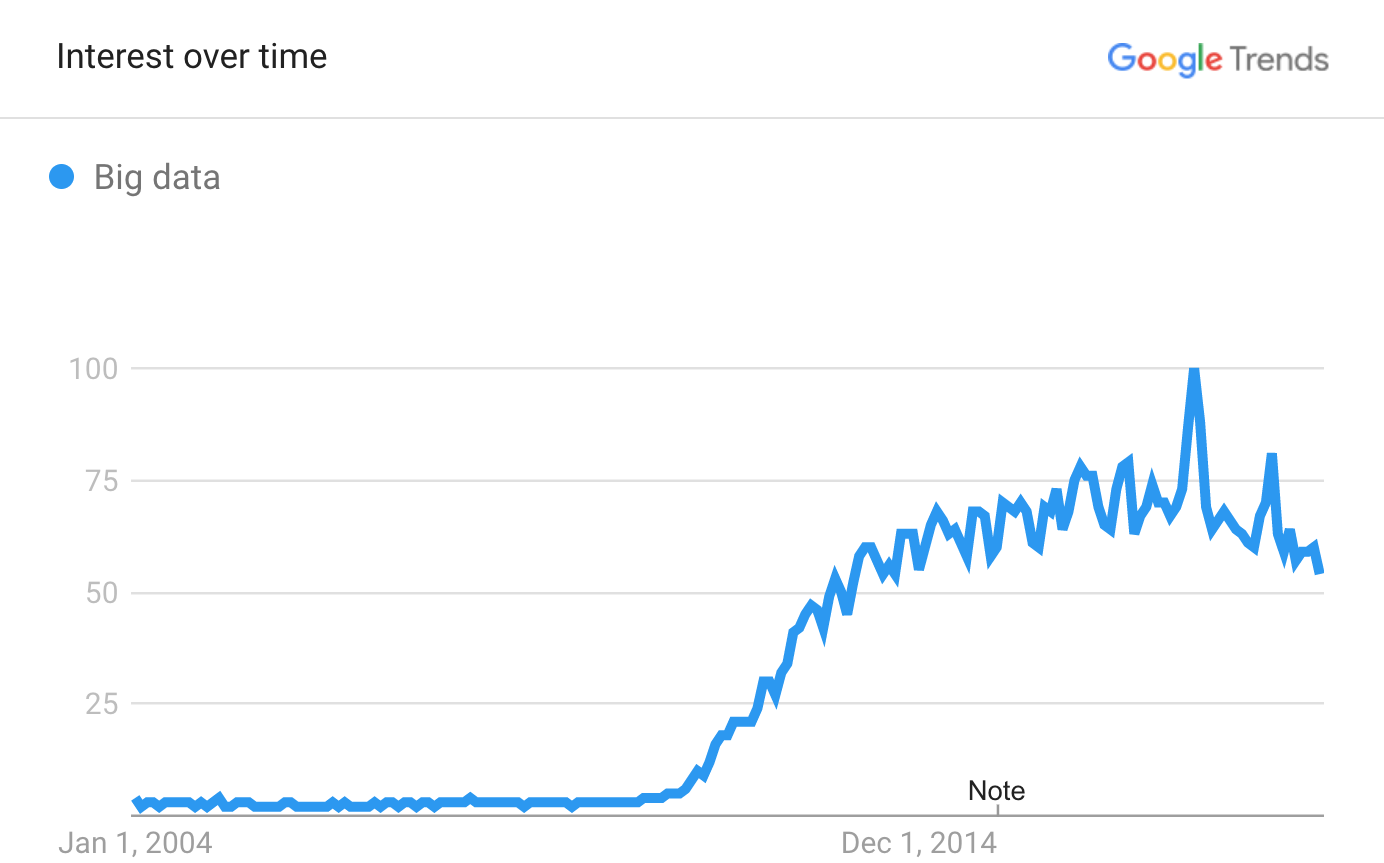
Big data also represents a shift in the way people and organizations think about data.

Relative interest in big data as a Google search term via Google Trends
Many organizations have come to see their data as a way to generate income, from developing new products to forming business strategies.
Big data now plays an increasingly large role in our everyday lives, often in ways we don’t think about. For example, research companies have developed algorithms that allow them to analyze the online activities of consumers, including their purchases, social media use, and online searches. The results allow them to look for trends and predict what types of advertisements are most likely to get our attention or to recommend movies, shows, news articles, products, and more.
Big data in the classroom#
Modern data science tools make it possible for students to explore data sets that are large and complex.
Big data can be described in terms of the four “Vs”:

Volume
The massive quantities of data, stored by terabytes, petabytes, or even exabytes.
A terabyte (TB) is a measure of computer storage capacity that is 1,024 gigabytes (GB), or approximately 1 million bytes.
A petabyte (PB) consists of 1,024 terabytes.
An exabyte (EB) consists of 1,024 petabytes.
Variety
The different sources or formats of big data. This could be everything from social media posts to digitized books and articles.
Velocity
The speed at which the data is growing or changing. Some data sets are constantly being updated with new observations from sensor devices. One example is a water quality monitor.
Veracity
Throughout this course we’ll be using tools and platforms that can handle big data in a classroom environment. Two important points we should consider are:
The larger the data set, the more computational time it takes to clean, transform, and analyze it. In a classroom it may be a problem to have students watch a spinning hourglass icon.
The more complex the data, the more challenging it can be to create a clear and useful visualization.
When using large and complex sources of data for classroom projects and demonstrations, consider working with a smaller subset of the data to help avoid these issues.
🏁 Actvity#

Visit the Los Angeles Open Data Portal and see if you can answer the following questions:
What is the “Most Accessed” data set? (Hint: “Sort by”)
How many times has it been viewed?
How many times has it been downloaded?
How many rows and columns are in this data set.
Discussion Board
Conclusion#
There are some advantages of collecting primary data, including being able to determine our data-collection process. However, collecting primary data takes more time and resources.
This is where secondary data sources, such as Statistics Canada, can help. The data is often already cleaned and is ready to use.
In the next unit, we’ll explore online sources of data sets. Many of these data sets are recent, or still being added to, which makes them useful for professionals including researchers, policy makers, and business strategists.

