

![]()
%%html

<script>
  function code_toggle() {
    if (code_shown){
      $('div.input').hide('500');
      $('#toggleButton').val('Show Code')
    } else {
      $('div.input').show('500');
      $('#toggleButton').val('Hide Code')
    }
    code_shown = !code_shown
  }

  $( document ).ready(function(){
    code_shown=false;
    $('div.input').hide()
  });
</script>
<p> Code is hidden for ease of viewing. Click the Show/Hide button to see. </>
<form action="javascript:code_toggle()"><input type="submit" id="toggleButton" value="Show Code"></form>
Code is hidden for ease of viewing. Click the Show/Hide button to see.
from IPython.display import HTML
import plotly.offline as py
import plotly.graph_objs as go
import numpy as np

py.init_notebook_mode(connected=True)
Appreciation of Math in Society
or
How the French Revolution Almost Led to a Canadian Tragedy
Introduction
Work on creating the metric system of measurement was started during the French Revolution. In Canada, we use the metric system for measuring length, mass, area, and volume. However, this was not always true. Before using the metric system, Canada used the British Imperial System of measurement. Canada’s change over to the metric system during the 1970s led to lots of problems. One of these problems was the fuel conversion mistake that led to Air Canada Flight 143 almost crashing in 1983.
Background
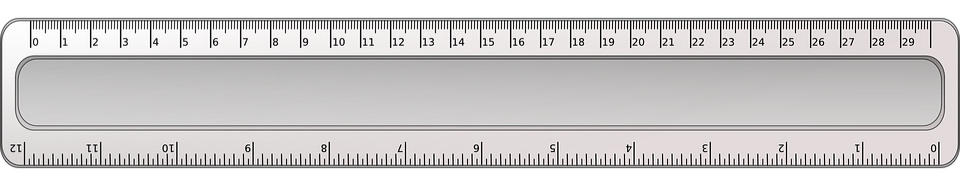
You might know about lots of different ways to measure things. People often measure land area in ‘acres’, or you might know your height in ‘feet’ and ‘inches’. Even the speedometer on a car shows ‘miles’ per hour right alongside kilometers per hour. Though Canada doesn’t officially use these measurements anymore, they still appear everywhere. But how were they made up in the first place? It turns out that they’ve been through some changes over the years. However, the original sources of these units of measurement may be surprising.
Let’s see where some of these wonderful measurements come from.

Simple, right? Although the Imperial System eventually became standardized, even the standards didn’t make sense! There were 12 inches in every foot, yet 3 feet to every yard, and 5280 feet to every mile. Anyone who wanted to learn the Imperial System spent most of their time memorizing the bizarre relationships between the units. Clearly a change was necessary. The change to order came from a time of chaos: the French Revolution.
The French Revolution Introduces the Metric System
At the end of the 1700s, the French people were completely fed up with their government. French monarchs had created a huge division between social classes, and living conditions were terrible. So, the French revolution began. Once the new government was in place, sweeping changes took place at every level of French life.
Education and science were two main areas of reform during the French revolution. A committee of some of the best French mathematicians and scientists was formed to create a new system of measurements.
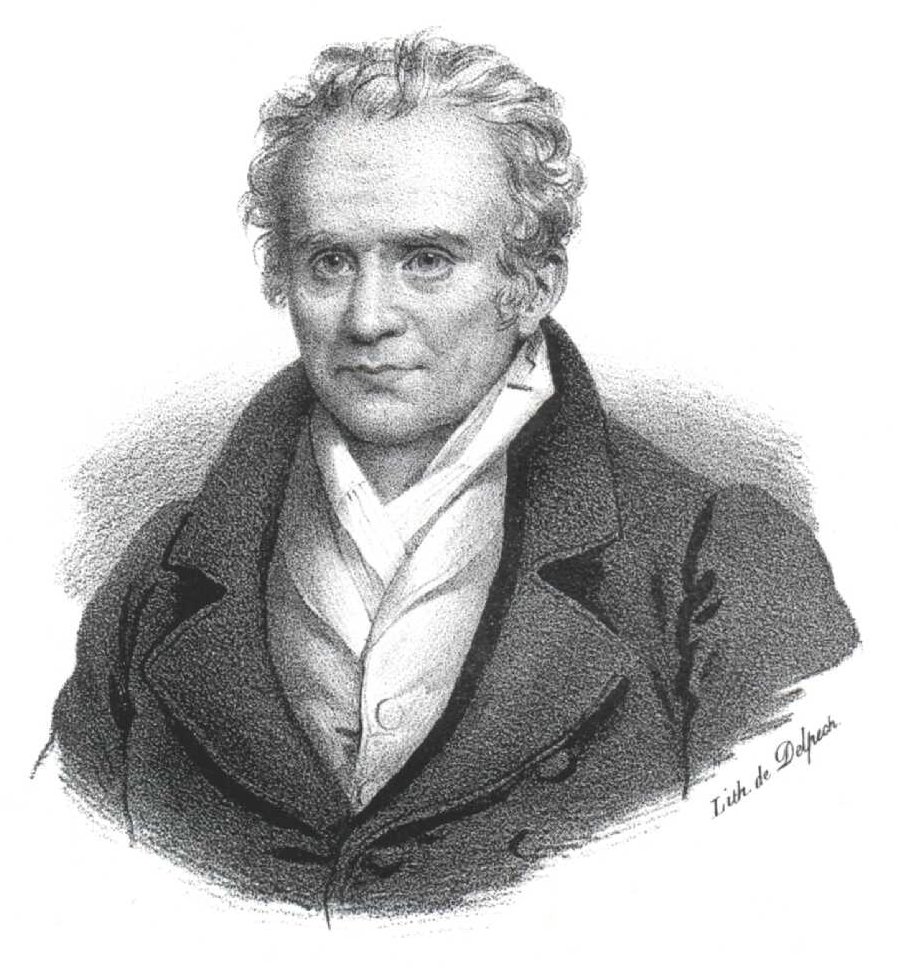

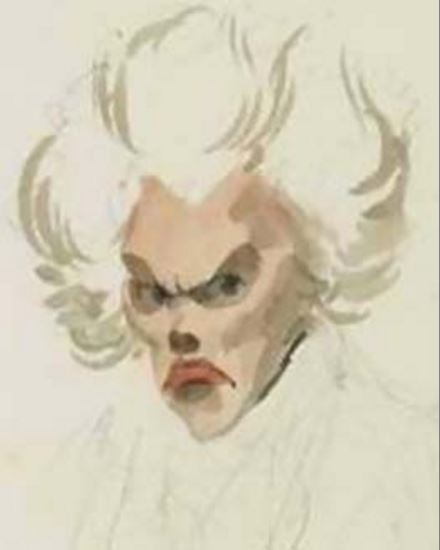
*Gaspard Monge, Pierre-Simon Laplace, and Adrien-Marie Legendre. Three brilliant mathematicians on the committee for creating a new system of measurements. For the full story on Legendre's strange portrait, see the Reference section at the end of this notebook.*
Along with the change in government, the French Revolution brought changes in thinking. It took place during the historical period known as the Enlightenment. Great thinkers of the time began basing their ideas on rationalism and the observable natural world instead of the mystical sources of the past. The committee on weights and measures decided that the metre should be based on a naturally observed distance. The length of the metre would be one ten millionth of the distance from the North Pole to the equator. In mathematical terms, this meant that if the distance from the North Pole to the equator was \(D\) and the length of a metre was \(x\), the length of the metre would be given by
Nicolas de Condorcet, a member of the committee on weights and measures, was selected to supervise the measurement of one metre. De Condorcet sent two astronomers, Jean Baptiste Joseph Delambre and Pierre Méchain, on an expedition to perform the measurement.

One quarter of the circumference of the Earth was assumed to be 10,000 km (it was later discovered to be closer to 10,009 km). Delambre and Méchain, the two astronomers assigned to measure the metre, surveyed the distance between Dunkirk, France and Barcelona, Spain. This path took them along the Paris meridian, the line of longitude that passed through Paris.
Beginning in Rodez, France - near the border with Spain - Delambre began traveling north to Dunkirk, measuring along the way. Méchain took the shorter route, traveling south to Barcelona. However, Méchain’s trip was much harder than Delambre’s. During the expedition, France declared war on Spain, which made Spanish authorities very suspicious of the French surveyors. Méchain also had to travel through mountains and unsurveyed portions of France and Spain. A more complete story of Méchain’s troubled journey, as well as an unfortunate mistake in his measurements, can be found here.
# Interactive plot of journeys of Delambre and Mechain.
rodez_dunkirk = [ dict(
    type = 'scattergeo',
    name = "Delambre's route",
    lat = [44.3506, 51.0383],
    lon = [2.575, 2.3775],
    hoverinfo = 'text',
    text = ['Rodez, France', 'Dunkirk, France'],
    mode = 'lines',
    line = dict(
        width = 2,
        color = 'rgb(0, 0, 204)',
    ),
) ]
rodez_barcelona = [ dict(
    type = 'scattergeo',
    name = "Méchain's route",
    lat = [44.3506, 41.383333],
    lon = [2.575, 2.183333],
    hoverinfo = 'text',
    text = ['Rodez, France', 'Barcelona, Spain'],
    mode = 'lines',
    line = dict(
        width = 2,
        color = 'rgb(0, 153, 0)',
    ),
) ]

layout1 = dict(
        title = 'Expedition to Measure the Metre',
        showlegend = True,
        geo = dict(
            resolution = 50,
            showland = True,
            showlakes = True,
            landcolor = 'rgb(204, 204, 204)',
            lakecolor = 'rgb(255, 255, 255)',
            projection = dict( type="mercator" ),
            coastlinewidth = 2,
            lataxis = dict(
                range = [ 40, 55 ],
                showgrid = True,
                tickmode = "linear",
                dtick = 10
            ),
            lonaxis = dict(
                range = [-10, 10],
                showgrid = True,
                tickmode = "linear",
                dtick = 10
            ),
        )
    )

fig = dict(data = rodez_dunkirk + rodez_barcelona, layout=layout1)

py.iplot(fig, validate=False)
When the expedition was complete, the distance between Dunkirk and Barcelona was extrapolated to the distance between the North Pole and the Equator along the Paris meridian.
# Interactive globe with expedition to measure meter and the quarter great circle through the meridian of Paris.
data = dict(
    type = 'scattergeo',
    lat = [0, 48.8566, 90], lon = [2.3522, 2.3522, 0],
    mode = 'lines',
    marker = dict(
        size = 10,
        color = 'rgba(152, 0, 0, .8)',
        line = dict(
            width = 1,
            color = 'rgb(152, 152, 0)'
        )
    ),
    text = ['','Paris, France','North Pole']
)

layout = dict(
        title = 'Original metre (one ten millionth of the length of the red line)<br>(Click and drag to rotate)',
        showlegend = False,
        geo = dict(
            showland = True,
            showlakes = True,
            showcountries = True,
            showocean = True,
            countrywidth = 0.5,
            landcolor = 'rgb(51, 204, 51)',
            lakecolor = 'rgb(0, 204, 255)',
            oceancolor = 'rgb(0, 204, 255)',
            projection = dict(
                type = 'orthographic',
                rotation = dict(
                    lon = -30,
                    lat = 30,
                    roll = 0
                )
            ),
            lonaxis = dict(
                showgrid = True,
                gridcolor = 'rgb(102, 102, 102)',
                gridwidth = 0.5
            ),
            lataxis = dict(
                showgrid = True,
                gridcolor = 'rgb(102, 102, 102)',
                gridwidth = 0.5
            )
        )
    )

fig = dict(data = [data], layout = layout)

py.iplot(fig)
The French metre was later updated when better measurements were available. After several international decisions, the modern version of the metre was finally established based on a new technique. However, the original metre was the first unit of measurement that had some basis in a natural phenomenon that wasn’t the length of a human body part or how far people could walk.
The metric system finally brought a system of measurement that made sense. Length, area, volume, and mass became directly related to each other through the metre.

Canada’s connection

Since Canada had been a British colony for so long, the confusing Imperial System of measurements was adopted for most of Canada’s history. In 1970, the process of converting all Canadian measurements was begun under Prime Minister Pierre Trudeau. This process took years to complete, and even longer for people to get used to the new measurements. Even today, Imperial units linger in lots of places, such as tape measures (feet and inches), land surveys (acres), thermometers (degrees Fahrenheit), and cooking (cups, tablespoons, and teaspoons).
Canada’s conversion to the metric system had some terrifying consequences one day in 1983, when a series of conversion mistakes almost led to the crash of a Boeing 767.
The Gimli Glider
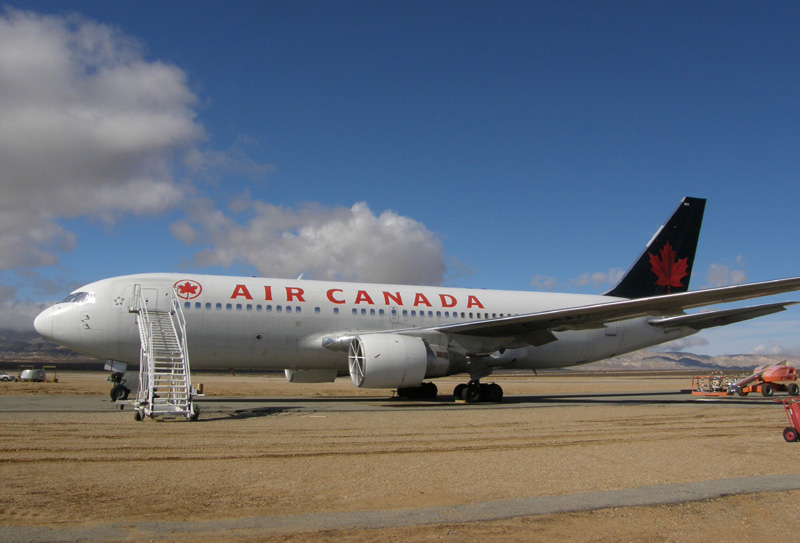
On July 23, 1983, Air Canada Flight 143 ran out of fuel in mid-air. With malfunctioning fuel gauges and a huge imperial-to-metric conversion mistake, what should have been a routine trip turned into a terrifying crisis. It was only due to the expert gliding of Captain Robert Pearson and the geographical knowledge of First Officer Maurice Quintal that the aircraft was crash landed safely and 69 people avoided tragedy.
Flight 143 was scheduled to travel from Montreal to Edmonton, with a stopover in Ottawa. The flight crew knew that the fuel gauges weren’t working properly. So, during the stopover in Ottawa, Captain Pearson made sure that the fuel levels were checked manually. The ground crew said that the flight had 11,430 litres of fuel in the tanks. Using this number, the flight crew calculated that they had 20,400 kilograms of fuel. This was more than enough to make it to Edmonton. Captain Pearson and First Officer Quintal checked the calculations three times. However, each time they calculated, they used the wrong unit conversion!
The flight crew wanted to know how many kilograms of fuel they had on board. However, they hadn’t been properly trained in the new metric way of measuring. They knew roughly how many litres of fuel were on the plane, so they used the following calculation to derive the mass of fuel:
However, they used the conversion factor of 1.77 pounds/litre. Therefore, their calculation led to this incorrect number:
Maybe you can see the problem with their calculation. They found out how many pounds of fuel they had on board, not how many kilograms they had. However, they read this as 20,231.1 kilograms of fuel! Since they hadn’t been trained on the new system, they didn’t know that they should have used the conversion factor of 0.8 kilograms/litre. Therefore, they should have calculated that they had $\(\text{mass} = \frac{0.8 \textbf{ kilograms}}{\text{litre}}\times 11,430\, \text{litres} = 9,144\, \mbox{kilograms of fuel}.\)$
The crew actually only had half as much fuel as they thought they did. When fuel was critical at 12,500 metres up, near the Ontario/Manitoba border, the crew went into emergency mode and requested clearance to land at Winnipeg. However, fuel ran out completely on the way to Winnipeg. Luckily, Co-pilot Quintal knew about an out-of-use military base at Gimli, Manitoba. With this knowledge and Captain Pearson’s years of flying gliders, the crew made for Gimli. It was a quiet glide until the plane broke through the cloud cover and the flight crew saw that over 100 people had gathered on the runways for “Family Day” of the Winnipeg Sport Car Club.
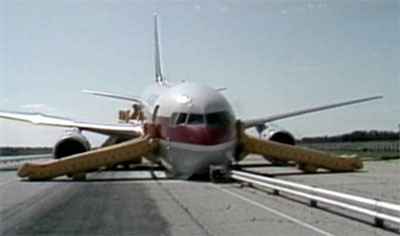
The people attending the drag races scattered as the airplane got closer and closer to the runway. A guard rail had been installed on the runway to create two drag lanes for racing. It was lucky that the guard rail was there, because the plane’s front landing gear failed, and the crew had to land the nose of the plane on the guard rail to keep it from smashing into the ground. After skidding down the runway, the plane finally stopped about 100 metres from the crowd.
All of the 69 people on board Flight 143 survived the crash landing. There were only 10 minor injuries, all of which happened when the passengers were using the escape slides. These slides were almost straight up and down since the front landing gear had failed.
Since Captain Pearson glided the huge aircraft to safety in Gimli, Manitoba, the airplane and the incident were called the “Gimli Glider”. There was some irony during the repairs of the plane. A repair crew was sent from Winnipeg. As they drove to fix the plane, their vehicle ran out of gas.
ottawa_edmonton = [ dict(
    type = 'scattergeo',
    name = 'Planned Flight Path',
    lat = [45.3192, 53.5444],
    lon = [-75.6692, -113.4909],
    hoverinfo = 'text',
    text = ['Ottawa', 'Edmonton'],
    mode = 'lines',
    line = dict(
        width = 2,
        color = 'blue',
    ),
) ]

ottawa_gimli = [ dict(
    type = 'scattergeo',
    name = 'Actual Flight Path',
    lat = [45.3192, 51.0333, 50.1489, 50.6336],
    lon = [-75.6692, -93.8333, -95.8806, -96.99],
    hoverinfo = 'text',
    text = ['Take off from Ottawa', 'Realize fuel is low - divert to Winnipeg', 'Not enough fuel to make Winnipeg - divert to Gimli', 'Crash land in Gimli'],
    mode = 'lines',
    line = dict(
        width = 2,
        color = 'red',
    ),
) ]

layout = dict(
        title = 'Air Canada Flight 143: Flight Paths',
        showlegend = True,
        geo = dict(
            resolution = 25,
            showland = True,
            showlakes = True,
            landcolor = 'rgb(204, 204, 204)',
            lakecolor = 'rgb(255, 255, 255)',
            projection = dict( type="mercator" ),
            coastlinewidth = 2,
            lataxis = dict(
                range = [ 45, 60 ],
                showgrid = True,
                tickmode = "linear",
                dtick = 10
            ),
            lonaxis = dict(
                range = [-120, -60],
                showgrid = True,
                tickmode = "linear",
                dtick = 20
            ),
        )
    )

fig = dict( data=ottawa_edmonton + ottawa_gimli, layout=layout )
py.iplot( fig, validate=False )
Summary
The introduction of the Metric System of Measurement gave an easy alternative to the confusing Imperial System. Not only were unit conversions easy, but the units for length, area, volume, and mass were finally related to each other in a straightforward way. Although most countries adopted the Metric System, the transition was not always smooth. It is always critical that, for any calculations involving units of measurement, you keep track of the units and convert them properly!
Questions
- Why would it be important for society to have a standardized system of measurements? What would be easier with a standardized system? Would anything be harder?
- Look at the calculation for how many pounds of fuel Flight 143 had on board (20,231.1 pounds). Now look at the correct calculation of 9,144 kilograms. Using the conversion factor of 0.4536 lbs/kg, convert 20,231.1 pounds into kilograms. Did you get 9,144 kilograms? Why might your number be different from 9,144 kilograms? (**Hint:** think of the conversion factor 0.8 kg/L. Given that this is a real calculation, how many decimal places would be reasonable to expect?)
- Make your own presentation about mathematics in society. To get you thinking about topics, consider the following:
- Another unit conversion mistake led to the 1999 crash of the [Mars Climate Orbiter](https://en.wikipedia.org/wiki/Mars_Climate_Orbiter).
- The Mars Curiosity Rover uses a mathematical algorithm for vision-based navigation. [JPL news release](https://www.jpl.nasa.gov/news/news.php?release=2013-259)
- Pythagoras and his followers had their core beliefs threatened by *irrational numbers*, such as $\sqrt{2}$. [Pythagoras and irrational numbers](https://brilliant.org/wiki/history-of-irrational-numbers/)
- There have been several number systems throughout history. One number system from Great Britain involved memorizing a rhyme to count sheep. [Counting sheep](https://en.wikipedia.org/wiki/Yan_Tan_Tethera)
- Discover other interesting applications of mathematics! To do this, you can dig a little bit into the background of almost any mathematical concept. You'll often be surprised at how much drama is there!
Sources
- Monge portrait by François Séraphin Delpech - http://www.sil.si.edu/digitalcollections/hst/scientific-identity/CF/by_name_display_results.cfm?scientist=Monge,%20Gaspard, Public Domain.
- Laplace portrait by Jean-Baptiste Paulin Guérin - http://www.photo.rmn.fr/, Public Domain.
- Legendre portrait by Julien-Léopold Boilly - http://www.numericana.com/answer/record.htm#legendre where it was cropped from here, Public Domain, https://commons.wikimedia.org/w/index.php?curid=6092195.
- De Condorcet portrait, Anonymous, http://www.allposters.com/gallery.asp?startat=/getPoster.asp&CID=6280537630C4496D95970E4DF46A24BF&frameSku=1735750_4986654-3893332 - Public Domain.
- Asimov, I. (1960). *Realm of Measure*. Fawcett Publications.
- Nelson, W. H. (2001). Gimli Glider. *Mobility Forum: The Journal of the Air Mobility Command's Magazine*, 10 (1), p. 24.
- For more information about the Gimli Glider, visit the museum website at http://www.gimliglider.com/gimliglider-com/.
