

![]()
Transformations: Positions and Motions of Objects and Shapes
Introduction
In this notebook we will be describing and analyzing the position and motion of objects and shapes in a 2-Dimensional space. To examine position and motion we will look at the Translations, Reflections and Rotations of objects and shapes in space. Translations are the change in position of an object or shape. Reflections are the mirror image of an object or shape with some axis on a graph. Rotations are an object or shape being rotated around a central point from 0 to 360 degrees.
Translations: Objects and Shapes in 2D Space
To analyze and describe objects and shapes in 2-Dimensional space we will use a Coordinate Plane with X and Y axes ranging from -10 to +10. When we translate an object or shape we are moving its position to another spot on the coordinate plane without changing the actual object or or its orientation. We will start off with a few examples showing how the translation of a rectangle works.
When we translate an object we are moving its position on the X and Y axis of the coordinate plane. When we refer to an object we are referring to a collection of points in the coordinate plane. Each point has an X and Y value that defines its position commonly written as (X, Y). To translate an object on the X axis we are adding or subtracting the same amount from every point that makes up an object.
For example we will look at the point (4,1)
We will translate the point +5 along the X axis and -3 along the Y axis
To translate the point we need to add the amount we are translating to the coordinates of the point.
(4+5,1-3) = (9,-2)
The new coordinates of the translated point are (9,-2)
Interactive Examples
The coordinate plane below allows you to translate an object’s position on the X axis by moving the slider. From the object’s current X position you can translate it back or forth by adding the value listed on the slider. Each value on the slider is the amount added to the original X position of the object. The original position of the object will remain highlighted in green and its translation will be highlighted in blue.
from plotly.offline import init_notebook_mode, iplot, plot
from ipywidgets import HBox
import plotly.graph_objs as go
import numpy as np
import random
from math import radians, cos, sin, sqrt, tan, atan
import ipywidgets as widgets
from IPython.display import Markdown
from IPython.display import HTML, clear_output

init_notebook_mode(connected=True)

square_clicked = True
triangle_clicked = False
start = False

square_button = widgets.Button(
    description='Square',
    disabled=False,
    button_style='success', # 'success', 'info', 'warning', 'danger' or ''
    tooltip='Click me',
)
triangle_button = widgets.Button(
    description='Triangle',
    disabled=False,
    button_style='', # 'success', 'info', 'warning', 'danger' or ''
    tooltip='Click me',
)

text_widget = widgets.HTML("<strong>Object: </strong>")

input_widget = widgets.HBox(children=[text_widget, square_button, triangle_button])

def graph_square():
    data = []
    data.append(dict(
        visible = True,
        line=dict(color='#00FF00', width=3),
        mode = 'lines+markers+text',
        name = 'Original',
        hoverinfo = 'x+y',
        text=['A','B','C','D',''],
        textposition='top left',
        textfont=dict(
            color='#ff0000'
        ),
        x = [1, 1, 4, 4, 1],
        y = [1, 4, 4, 1, 1]))

    data.append(dict(
        visible = True,
        line=dict(color='#00CED1', width=3),
        mode = 'lines+markers+text',
        name = 'Translation',
        hoverinfo = 'x+y',
        text=['A','B','C','D',''],
        textposition='top left',
        textfont=dict(
            color='#ff0000'
        ),
        x = [1, 1, 4, 4, 1],
        y = [1, 4, 4, 1, 1]))


    steps = []
    for i in range(18):
        if((i-11) > 0):
            temp = "+" + str(i-11)
        else:
            temp = str(i-11)

        step = dict(
            method = 'restyle',
            args = [{'x[0]':[1,-10+i],'x[1]':[1,-10+i],'x[2]':[4,-7+i],'x[3]':[4,-7+i],'x[4]':[1,-10+i]}],
            label = temp
        )
        steps.append(step)


    sliders = [dict(
        active = 11,
        currentvalue = {"prefix": "X axis translation: ", },
        pad = {"t": 35},
        steps = steps
        )]

    layout = go.Layout(
            title = 'Translation on the X Axis',
            sliders=sliders,
            showlegend=False,
            hovermode = 'closest',
            yaxis = dict(
                title= '',
                #xanchor = 'left',
                #yanchor = 'top',
                ticklen= 5,
                dtick= 1,
                gridwidth= 2,
                range=[-10,10],
                showgrid=True,

            ),
            xaxis= dict(
                title= '',
                ticklen= 5,
                dtick=1,
                gridwidth= 2,
                range=[-10,10],
                showgrid=True,
            ),
            annotations=[
                dict(
                    x=1.0,
                    y=-0.16,
                    showarrow=False,
                    text='X Axis',
                    xref='paper',
                    yref='paper',
                    font=dict(
                        size=14,
                    ),
                ),
                dict(
                    x=-0.06,
                    y=1.0,
                    showarrow=False,
                    text='Y Axis',
                    textangle=-90,
                    xref='paper',
                    yref='paper',
                    font=dict(
                        size=14,
                    ),
                ),
            ],
            #autosize=False,
            #width=950,
            #height=650,
    )

    fig = dict(data=data, layout=layout)

    clear_output(wait=True)

    display(input_widget)


    #iplot(fig, filename = 'filename')
    return fig

def graph_triangle():
    dataT = []
    dataT.append(dict(
        visible = True,
        line=dict(color='#00FF00', width=3),
        mode = 'lines+markers+text',
        name = 'Original',
        hoverinfo = 'x+y',
        text=['A','B','C',''],
        textposition='top left',
        textfont=dict(
            color='#ff0000'
        ),
        x = [1, 2.5, 4, 1],
        y = [1, 4, 1, 1]))

    dataT.append(dict(
        visible = True,
        line=dict(color='#00CED1', width=3),
        mode = 'lines+markers+text',
        name = 'Translation',
        hoverinfo = 'x+y',
        text=['A','B','C',''],
        textposition='top left',
        textfont=dict(
            color='#ff0000'
        ),
        x = [1, 2.5, 4, 1],
        y = [1, 4, 1, 1]))

    stepsT = []
    for i in range(18):
        if((i-11) > 0):
            temp = "+" + str(i-11)
        else:
            temp = str(i-11)

        step = dict(
            method = 'restyle',
            args = [{'x[0]':[1,-10+i],'x[1]':[2.5,-8.5+i],'x[2]':[4,-7+i],'x[3]':[1,-10+i]}],
            label = temp
        )
        stepsT.append(step)


    slidersT = [dict(
        active = 11,
        currentvalue = {"prefix": "X axis translation: ", },
        pad = {"t": 35},
        steps = stepsT
    )]

    layoutT = go.Layout(
            title = 'Translation on the X Axis',
            sliders=slidersT,
            showlegend=False,
            hovermode = 'closest',
            yaxis = dict(
                title= '',
                ticklen= 5,
                dtick= 1,
                gridwidth= 2,
                range=[-10,10],
                showgrid=True,

            ),
            xaxis= dict(
                title= '',
                ticklen= 5,
                dtick=1,
                gridwidth= 2,
                range=[-10,10],
                showgrid=True,
            ),
            annotations=[
                dict(
                    x=1.0,
                    y=-0.16,
                    showarrow=False,
                    text='X Axis',
                    xref='paper',
                    yref='paper',
                    font=dict(
                        size=14,
                    ),
                ),
                dict(
                    x=-0.06,
                    y=1.0,
                    showarrow=False,
                    text='Y Axis',
                    textangle=-90,
                    xref='paper',
                    yref='paper',
                    font=dict(
                        size=14,
                    ),
                ),
            ],
            #autosize=False,
            #width=950,
            #height=650,
    )


    figT = dict(data=dataT, layout=layoutT)

    clear_output(wait=True)

    display(input_widget)
    # Plot and embed in ipython notebook!
    iplot(figT, filename='basic-scatter')


def square_update(change):
    global square_clicked
    global triangle_clicked

    if(not(square_clicked)):
        square_clicked = True
        triangle_clicked = False
        square_button.button_style = 'success'
        triangle_button.button_style = ''
        graph_square()


def triangle_update(change):
    global square_clicked
    global triangle_clicked

    if(not(triangle_clicked)):
        triangle_clicked = True
        square_clicked = False
        square_button.button_style = ''
        triangle_button.button_style = 'success'
        graph_triangle()

square_button.on_click(square_update)

triangle_button.on_click(triangle_update)

fig = graph_square()

iplot(fig)
The coordinate plane below allows you to translate an object’s position on the Y axis by moving the slider. From the object’s current Y position you can translate it up or down by adding the value listed on the slider. Each value on the slider is the amount added to the original Y position of the object. The original position of the object will remain highlighted in green and its translation will be highlighted in blue.
square_clicked1 = True
triangle_clicked1 = False

square_button1 = widgets.Button(
    description='Square',
    disabled=False,
    button_style='success', # 'success', 'info', 'warning', 'danger' or ''
    tooltip='Click me',
)
triangle_button1 = widgets.Button(
    description='Triangle',
    disabled=False,
    button_style='', # 'success', 'info', 'warning', 'danger' or ''
    tooltip='Click me',
)

text_widget1 = widgets.HTML("<strong>Object: </strong>")

input_widget1 = widgets.HBox(children=[text_widget1, square_button1, triangle_button1])

def graph_square1():

    init_notebook_mode(connected=True)

    data1 = []
    data1.append(dict(
        visible = True,
        line=dict(color='#00FF00', width=3),
        mode = 'lines+markers+text',
        name = 'Original',
        hoverinfo = 'x+y',
        text=['A','B','C','D',''],
        textposition='top left',
        textfont=dict(
            color='#ff0000'
        ),
        x = [1, 1, 4, 4, 1],
        y = [1, 4, 4, 1, 1]))

    data1.append(dict(
        visible = True,
        line=dict(color='#00CED1', width=3),
        mode = 'lines+markers+text',
        name = 'Translation',
        hoverinfo = 'x+y',
        text=['A','B','C','D',''],
        textposition='top left',
        textfont=dict(
            color='#ff0000'
        ),
        x = [1, 1, 4, 4, 1],
        y = [1, 4, 4, 1, 1]))

    steps1 = []
    for i in range(18):
        if((i-11) > 0):
            temp = "+" + str(i-11)
        else:
            temp = str(i-11)

        step = dict(
            method = 'restyle',
            args = [{'y[0]':[1,-7+i],'y[1]':[4,-10+i],'y[2]':[4,-10+i],'y[3]':[1,-7+i],'y[4]':[1,-7+i]}],
            label = temp
        )
        steps1.append(step)

    sliders1 = [dict(
        active = 11,
        currentvalue = {"prefix": "Y axis translation: ", },
        pad = {"t": 35},
        steps = steps1
    )]

    layout1 = go.Layout(
            title = 'Translation on the Y Axis',
            sliders=sliders1,
            showlegend=False,
            hovermode = 'closest',
            yaxis = dict(
                title= '',
                ticklen= 5,
                dtick= 1,
                gridwidth= 2,
                range=[-10,10],
                showgrid=True,

            ),
            xaxis= dict(
                title= '',
                ticklen= 5,
                dtick=1,
                gridwidth= 2,
                range=[-10,10],
                showgrid=True,
            ),
            annotations=[
                dict(
                    x=1.0,
                    y=-0.16,
                    showarrow=False,
                    text='X Axis',
                    xref='paper',
                    yref='paper',
                    font=dict(
                        size=14,
                    ),
                ),
                dict(
                    x=-0.06,
                    y=1.0,
                    showarrow=False,
                    text='Y Axis',
                    textangle=-90,
                    xref='paper',
                    yref='paper',
                    font=dict(
                        size=14,
                    ),
                ),
            ],
    )

    fig1 = dict(data=data1, layout=layout1)
    clear_output(wait=True)

    display(input_widget1)
    iplot(fig1, filename='basic-scatter')

def graph_triangle1():
    init_notebook_mode(connected=True)

    dataT1 = []
    dataT1.append(dict(
        visible = True,
        line=dict(color='#00FF00', width=3),
        mode = 'lines+markers+text',
        name = 'Original',
        hoverinfo = 'x+y',
        text=['A','B','C',''],
        textposition='top left',
        textfont=dict(
            color='#ff0000'
        ),
        x = [1, 2.5, 4, 1],
        y = [1, 4, 1, 1]))

    dataT1.append(dict(
        visible = True,
        line=dict(color='#00CED1', width=3),
        mode = 'lines+markers+text',
        name = 'Translation',
        hoverinfo = 'x+y',
        text=['A','B','C',''],
        textposition='top left',
        textfont=dict(
            color='#ff0000'
        ),
        x = [1, 2.5, 4, 1],
        y = [1, 4, 1, 1]))

    stepsT1 = []
    for i in range(18):
        if((i-11) > 0):
            temp = "+" + str(i-11)
        else:
            temp = str(i-11)

        step = dict(
            method = 'restyle',
            args = [{'y[0]':[1,-10+i],'y[1]':[4,-7+i],'y[2]':[1,-10+i],'y[3]':[1,-10+i]}],
            label = temp
        )
        stepsT1.append(step)

    slidersT1 = [dict(
        active = 11,
        currentvalue = {"prefix": "Y axis translation: ", },
        pad = {"t": 35},
        steps = stepsT1
    )]

    layoutT1 = go.Layout(
            title = 'Translation on the Y Axis',
            sliders=slidersT1,
            showlegend=False,
            hovermode = 'closest',
            yaxis = dict(
                title= '',
                ticklen= 5,
                dtick= 1,
                gridwidth= 2,
                range=[-10,10],
                showgrid=True,
            ),
            xaxis= dict(
                title= '',
                ticklen= 5,
                dtick=1,
                gridwidth= 2,
                range=[-10,10],
                showgrid=True,
            ),
            annotations=[
                dict(
                    x=1.0,
                    y=-0.16,
                    showarrow=False,
                    text='X Axis',
                    xref='paper',
                    yref='paper',
                    font=dict(
                        size=14,
                    ),
                ),
                dict(
                    x=-0.06,
                    y=1.0,
                    showarrow=False,
                    text='Y Axis',
                    textangle=-90,
                    xref='paper',
                    yref='paper',
                    font=dict(
                        size=14,
                    ),
                ),
            ],
    )


    figT1 = dict(data=dataT1, layout=layoutT1)
    clear_output(wait=True)

    display(input_widget1)
    iplot(figT1, filename='basic-scatter')

def square_update1(change):
    global square_clicked1
    global triangle_clicked1

    if(not(square_clicked1)):
        square_clicked1 = True
        triangle_clicked1 = False
        square_button1.button_style = 'success'
        triangle_button1.button_style = ''
        graph_square1()


def triangle_update1(change):
    global square_clicked1
    global triangle_clicked1

    if(not(triangle_clicked1)):
        triangle_clicked1 = True
        square_clicked1 = False
        square_button1.button_style = ''
        triangle_button1.button_style = 'success'
        graph_triangle1()

square_button1.on_click(square_update1)

triangle_button1.on_click(triangle_update1)

graph_square1()
The coordinate plane below allows you to translate an object’s position on the X and Y axes by moving the two sliders. From the object’s original X position you can move it back or forth by adding the value listed on the top slider. From the object’s original Y position you can move it up or down by adding the value listed on the bottom slider. The original position of the object will remain highlighted in green and its translation will be highlighted in blue.
square_clicked2 = True
triangle_clicked2 = False

square_button2 = widgets.Button(
    description='Square',
    disabled=False,
    button_style='success', # 'success', 'info', 'warning', 'danger' or ''
    tooltip='Click me',
)
triangle_button2 = widgets.Button(
    description='Triangle',
    disabled=False,
    button_style='', # 'success', 'info', 'warning', 'danger' or ''
    tooltip='Click me',
)

text_widget2 = widgets.HTML("<strong>Object: </strong>")

input_widget2 = widgets.HBox(children=[text_widget2, square_button2, triangle_button2])

def graph_square2():
    init_notebook_mode(connected=True)

    data2 = []
    data2.append(dict(
        visible = True,
        line=dict(color='#00FF00', width=3),
        mode = 'lines+markers+text',
        name = 'Original',
        hoverinfo = 'x+y',
        text=['A','B','C','D',''],
        textposition='top left',
        textfont=dict(
            color='#ff0000'
        ),
        x = [1, 1, 4, 4, 1],
        y = [1, 4, 4, 1, 1]))

    data2.append(dict(
        visible = True,
        line=dict(color='#00CED1', width=3),
        mode = 'lines+markers+text',
        name = 'Translation',
        hoverinfo = 'x+y',
        text=['A','B','C','D',''],
        textposition='top left',
        textfont=dict(
            color='#ff0000'
        ),
        x = [1, 1, 4, 4, 1],
        y = [1, 4, 4, 1, 1]))

    steps2 = []
    for i in range(18):
        if((i-11) > 0):
            temp = "+" + str(i-11)
        else:
            temp = str(i-11)

        step = dict(
            method = 'restyle',
            args = [{'x[0]':[1,-10+i],'x[1]':[1,-10+i],'x[2]':[4,-7+i],'x[3]':[4,-7+i],'x[4]':[1,-10+i]}],
            label = temp
        )
        steps2.append(step)

    steps3 = []
    for i in range(18):
        if((i-11) > 0):
            temp = "+" + str(i-11)
        else:
            temp = str(i-11)

        step = dict(
            method = 'restyle',
            args = [{'y[0]':[1,-7+i],'y[1]':[4,-10+i],'y[2]':[4,-10+i],'y[3]':[1,-7+i],'y[4]':[1,-7+i]}],
            label = temp
        )
        steps3.append(step)

    sliders2 = [dict(
        active = 11,
        currentvalue = {"prefix": "X axis translation: ", },
        pad = {"t": 35},
        steps = steps2
    )]

    tempSlider = dict(
        active = 11,
        currentvalue = {"prefix": "Y axis translation: ", },
        pad = {"t": 120},
        steps = steps3
    )

    sliders2.append(tempSlider)

    layout2 = go.Layout(
            title = 'Translation on the Coordinate Plane',
            sliders=sliders2,
            showlegend=False,
            hovermode = 'closest',
            yaxis = dict(
                title= '',
                ticklen= 5,
                dtick= 1,
                gridwidth= 2,
                range=[-10,10],
                showgrid=True,
            ),
            xaxis= dict(
                title= '',
                ticklen= 5,
                dtick=1,
                gridwidth= 2,
                range=[-10,10],
                showgrid=True,
            ),
            autosize=False,
            width=950,
            height=650,
            annotations=[
                dict(
                    x=1.0,
                    y=-0.16,
                    showarrow=False,
                    text='X Axis',
                    xref='paper',
                    yref='paper',
                    font=dict(
                        size=14,
                    ),
                ),
                dict(
                    x=-0.06,
                    y=1.0,
                    showarrow=False,
                    text='Y Axis',
                    textangle=-90,
                    xref='paper',
                    yref='paper',
                    font=dict(
                        size=14,
                    ),
                ),
            ],
    )

    fig2 = dict(data=data2, layout=layout2)
    clear_output(wait=True)
    display(input_widget2)
    iplot(fig2, filename='basic-scatter')


def graph_triangle2():
    init_notebook_mode(connected=True)

    dataT2 = []
    dataT2.append(dict(
        visible = True,
        line=dict(color='#00FF00', width=3),
        mode = 'lines+markers+text',
        name = 'Original',
        hoverinfo = 'x+y',
        text=['A','B','C',''],
        textposition='top left',
        textfont=dict(
            color='#ff0000'
        ),
        x = [1, 2.5, 4, 1],
        y = [1, 4, 1, 1]))

    dataT2.append(dict(
        visible = True,
        line=dict(color='#00CED1', width=3),
        mode = 'lines+markers+text',
        name = 'Translation',
        hoverinfo = 'x+y',
        text=['A','B','C',''],
        textposition='top left',
        textfont=dict(
            color='#ff0000'
        ),
        x = [1, 2.5, 4, 1],
        y = [1, 4, 1, 1]))

    stepsT2 = []
    for i in range(18):
        if((i-11) > 0):
            temp = "+" + str(i-11)
        else:
            temp = str(i-11)

        step = dict(
            method = 'restyle',
            args = [{'x[0]':[1,-10+i],'x[1]':[2.5,-8.5+i],'x[2]':[4,-7+i],'x[3]':[1,-10+i]}],
            label = temp
        )
        stepsT2.append(step)


    stepsT3 = []
    for i in range(18):
        if((i-11) > 0):
            temp = "+" + str(i-11)
        else:
            temp = str(i-11)

        step = dict(
            method = 'restyle',
            args = [{'y[0]':[1,-10+i],'y[1]':[4,-7+i],'y[2]':[1,-10+i],'y[3]':[1,-10+i]}],
            label = temp
        )
        stepsT3.append(step)

    slidersT2 = [dict(
        active = 11,
        currentvalue = {"prefix": "X axis translation: ", },
        pad = {"t": 35},
        steps = stepsT2
    )]

    tempSlider = dict(
        active = 11,
        currentvalue = {"prefix": "Y axis translation: ", },
        pad = {"t": 120},
        steps = stepsT3
    )

    slidersT2.append(tempSlider)

    layoutT2 = go.Layout(
            title = 'Translation on the Coordinate Plane',
            sliders=slidersT2,
            showlegend=False,
            hovermode = 'closest',
            yaxis = dict(
                title= '',
                ticklen= 5,
                dtick= 1,
                gridwidth= 2,
                range=[-10,10],
                showgrid=True,
            ),
            xaxis= dict(
                title= '',
                ticklen= 5,
                dtick=1,
                gridwidth= 2,
                range=[-10,10],
                showgrid=True,
            ),
            autosize=False,
            width=950,
            height=650,
            annotations=[
                dict(
                    x=1.0,
                    y=-0.16,
                    showarrow=False,
                    text='X Axis',
                    xref='paper',
                    yref='paper',
                    font=dict(
                        size=14,
                    ),
                ),
                dict(
                    x=-0.06,
                    y=1.0,
                    showarrow=False,
                    text='Y Axis',
                    textangle=-90,
                    xref='paper',
                    yref='paper',
                    font=dict(
                        size=14,
                    ),
                ),
            ],
    )

    figT2 = dict(data=dataT2, layout=layoutT2)
    clear_output(wait=True)
    display(input_widget2)
    iplot(figT2, filename='basic-scatter')


def square_update2(change):
    global square_clicked2
    global triangle_clicked2

    if(not(square_clicked2)):
        square_clicked2 = True
        triangle_clicked2 = False
        square_button2.button_style = 'success'
        triangle_button2.button_style = ''
        graph_square2()


def triangle_update2(change):
    global square_clicked2
    global triangle_clicked2

    if(not(triangle_clicked2)):
        triangle_clicked2 = True
        square_clicked2 = False
        square_button2.button_style = ''
        triangle_button2.button_style = 'success'
        graph_triangle2()

square_button2.on_click(square_update2)

triangle_button2.on_click(triangle_update2)

graph_square2()
The coordinate plane below allows you to translate an object’s position on the X and Y axes by entering the amount you want to translate it on the inputs below. This interactive example allows you to continually translate the object from its translated position. This means that the original position becomes the previous translated position once new coordinates have been entered. As above the original position of the object will remain highlighted in green and its translation will be highlighted in blue.
square_clickedTr = True
triangle_clickedTr = False

initialX = [1, 1, 4, 4, 1]
initialY = [1, 4, 4, 1, 1]

init_notebook_mode(connected=True)

square_buttonTr = widgets.Button(
    description='Square',
    disabled=False,
    button_style='success', # 'success', 'info', 'warning', 'danger' or ''
    tooltip='Click me',
)
triangle_buttonTr = widgets.Button(
    description='Triangle',
    disabled=False,
    button_style='', # 'success', 'info', 'warning', 'danger' or ''
    tooltip='Click me',
)

text_widgetTr = widgets.HTML("<strong>Object: </strong>")

x_translation = widgets.Text(
    value='0',
    placeholder='',
    description='',
    disabled=False
)

y_translation = widgets.Text(
    value='0',
    placeholder='',
    description='',
    disabled=False
)

input_button = widgets.Button(
    description='Translate',
    disabled=False,
    button_style='', # 'success', 'info', 'warning', 'danger' or ''
    tooltip='Click me',
)

error_output = widgets.HTML("")

x_text = widgets.HTML("<strong>X Translation: </strong>")
y_text = widgets.HTML("<strong>Y Translation: </strong>")

object_widgetTr = widgets.HBox(children=[text_widgetTr, square_buttonTr, triangle_buttonTr])

submit_output = widgets.HBox(children=[x_text, x_translation, y_text, y_translation, input_button])

input_widgetTr = widgets.VBox(children=[object_widgetTr, submit_output, error_output])

x_translation.layout.width = '100px'
y_translation.layout.width = '100px'

def translationSq(xT,yT,xTo,yTo):
    dataSq = []
    dataSq.append(dict(
        visible = True,
        line=dict(color='#00FF00', width=3),
        mode = 'lines+markers+text',
        name = 'Original',
        hoverinfo = 'x+y',
        text=['A','B','C','D',''],
        textposition='top left',
        textfont=dict(
            color='#ff0000'
        ),
        x = xTo,#[1, 2.5, 4, 1],
        y = yTo))#[1, 4, 1, 1]))

    dataSq.append(dict(
        visible = True,
        line=dict(color='#00CED1', width=3),
        mode = 'lines+markers+text',
        name = 'Translation',
        hoverinfo = 'x+y',
        text=['A','B','C','D',''],
        textposition='top left',
        textfont=dict(
            color='#ff0000'
        ),
        x = xT,#[1, 2.5, 4, 1],
        y = yT))#[1, 4, 1, 1]))


    layoutSq = go.Layout(
            title = 'Translation on the Coordinate Plane',
            showlegend=False,
            hovermode = 'closest',
            yaxis = dict(
                title= '',
                ticklen= 5,
                dtick= 1,
                gridwidth= 2,
                range=[-10,10],
                showgrid=True,

            ),
            xaxis= dict(
                title= '',
                ticklen= 5,
                dtick=1,
                gridwidth= 2,
                range=[-10,10],
                showgrid=True,
            ),
            autosize=True,
            #width=750,
            #height=725,
            annotations=[
                dict(
                    x=1.0,
                    y=-0.16,
                    showarrow=False,
                    text='X Axis',
                    xref='paper',
                    yref='paper',
                    font=dict(
                        size=14,
                    ),
                ),
                dict(
                    x=-0.06,
                    y=1.0,
                    showarrow=False,
                    text='Y Axis',
                    textangle=-90,
                    xref='paper',
                    yref='paper',
                    font=dict(
                        size=14,
                    ),
                ),
            ],
    )

    figSq = dict(data=dataSq, layout=layoutSq)

    clear_output(wait=True)

    display(input_widgetTr)
    iplot(figSq, filename = 'filename')


def translationTr(xT,yT,xTo,yTo):
    dataTr = []
    dataTr.append(dict(
        visible = True,
        line=dict(color='#00FF00', width=3),
        mode = 'lines+markers+text',
        name = 'Original',
        hoverinfo = 'x+y',
        text=['A','B','C',''],
        textposition='top left',
        textfont=dict(
            color='#ff0000'
        ),
        x = xTo,#[1, 2.5, 4, 1],
        y = yTo))#[1, 4, 1, 1]))

    dataTr.append(dict(
        visible = True,
        line=dict(color='#00CED1', width=3),
        mode = 'lines+markers+text',
        name = 'Translation',
        hoverinfo = 'x+y',
        text=['A','B','C',''],
        textposition='top left',
        textfont=dict(
            color='#ff0000'
        ),
        x = xT,#[1, 2.5, 4, 1],
        y = yT))#[1, 4, 1, 1]))


    layoutTr = go.Layout(
            title = 'Translation on the Coordinate Plane',
            showlegend=False,
            hovermode = 'closest',
            yaxis = dict(
                title= '',
                ticklen= 5,
                dtick= 1,
                gridwidth= 2,
                range=[-10,10],
                showgrid=True,

            ),
            xaxis= dict(
                title= '',
                ticklen= 5,
                dtick=1,
                gridwidth= 2,
                range=[-10,10],
                showgrid=True,
            ),
            autosize=True,
            #width=750,
            #height=725,
            annotations=[
                dict(
                    x=1.0,
                    y=-0.16,
                    showarrow=False,
                    text='X Axis',
                    xref='paper',
                    yref='paper',
                    font=dict(
                        size=14,
                    ),
                ),
                dict(
                    x=-0.06,
                    y=1.0,
                    showarrow=False,
                    text='Y Axis',
                    textangle=-90,
                    xref='paper',
                    yref='paper',
                    font=dict(
                        size=14,
                    ),
                ),
            ],
    )

    figTr = dict(data=dataTr, layout=layoutTr)

    clear_output(wait=True)

    display(input_widgetTr)
    iplot(figTr, filename = 'filename')


def update_graph(change):
    global initialX
    global initialY
    global square_clickedTr
    global triangle_clickedTr
    error = False

    try:
        translationX = float(x_translation.value)
        translationY = float(y_translation.value)
    except ValueError:
        error_output.value = "Those were not translation numbers.  Please enter valid numbers and submit again"
        error = True

    x_translation.value = '0'
    y_translation.value = '0'

    if(not(error)):
        if((initialX[2] + translationX) > 10):
            error_output.value = "The X translation is too high."
            error = True
        elif((initialX[0] + translationX) < -10):
            error_output.value = "The X translation is too low."
            error = True
        elif((initialY[1] + translationY) > 10):
            error_output.value = "The Y translation is too high."
            error = True
        elif((initialY[0] + translationY) < -10):
            error_output.value = "The Y translation is too low."
            error = True

    if(not(error)):
        error_output.value = ""
        update_X = initialX[:]
        update_Y = initialY[:]

        for i in range(len(initialX)):
            update_X[i] = update_X[i] + translationX
            update_Y[i] = update_Y[i] + translationY

        if(square_clickedTr):
            translationSq(update_X,update_Y, initialX, initialY)
        elif(triangle_clickedTr):
            translationTr(update_X,update_Y, initialX, initialY)

        initialX = update_X[:]
        initialY = update_Y[:]


def square_updateTr(change):
    global square_clickedTr
    global triangle_clickedTr
    global initialX
    global initialY

    if(not(square_clickedTr)):
        square_clickedTr = True
        triangle_clickedTr = False
        initialX = [1, 1, 4, 4, 1]
        initialY = [1, 4, 4, 1, 1]
        square_buttonTr.button_style = 'success'
        triangle_buttonTr.button_style = ''
        clear_output(wait=True)
        display(input_widgetTr)
        x_translation.value = '0'
        y_translation.value = '0'
        translationSq(initialX, initialY, initialX, initialY)


def triangle_updateTr(change):
    global square_clickedTr
    global triangle_clickedTr
    global initialX
    global initialY

    if(not(triangle_clickedTr)):
        triangle_clickedTr = True
        square_clickedTr = False
        initialX = [1, 2.5, 4, 1]
        initialY = [1, 4, 1, 1]
        square_buttonTr.button_style = ''
        triangle_buttonTr.button_style = 'success'
        clear_output(wait=True)
        display(input_widgetTr)
        x_translation.value = '0'
        y_translation.value = '0'
        translationTr(initialX, initialY, initialX, initialY)


square_buttonTr.on_click(square_updateTr)

triangle_buttonTr.on_click(triangle_updateTr)

input_button.on_click(update_graph)

translationSq(initialX, initialY, initialX, initialY)
#input_widgetTr
Reflections: Objects and Shapes in 2D Space
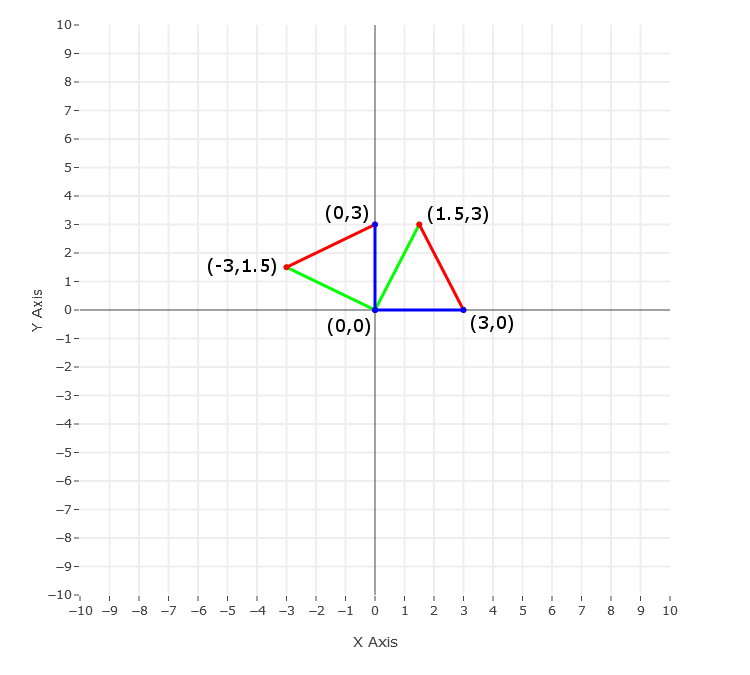
When we reflect an object or shape across an axis we are changing the signs of the coordinate points of the object. If an object is reflected about the X axis we would reverse the signs of all the X coordinates of the object to determine the reflection. You can think of it as multiplying all the X coordinates by -1. Similarly if you reflect an object about the Y axis we would reverse the signs of all the points’ Y coordinates to find the reflection.
An object can also be reflected across a line that is not at the origin (X=0 or Y=0). You could have an object being reflected across a line positioned at x = 1 or it could be at a positioned at y = 1. If a line is horizontal similar to the X axis we will be changing the Y coordinates of the object and if the line is vertical we will only be changing the X coordinates.
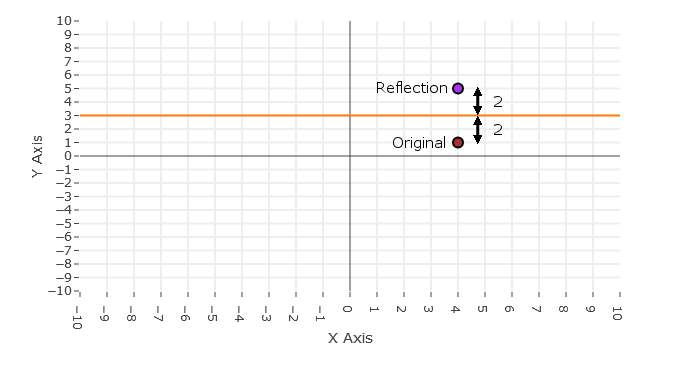
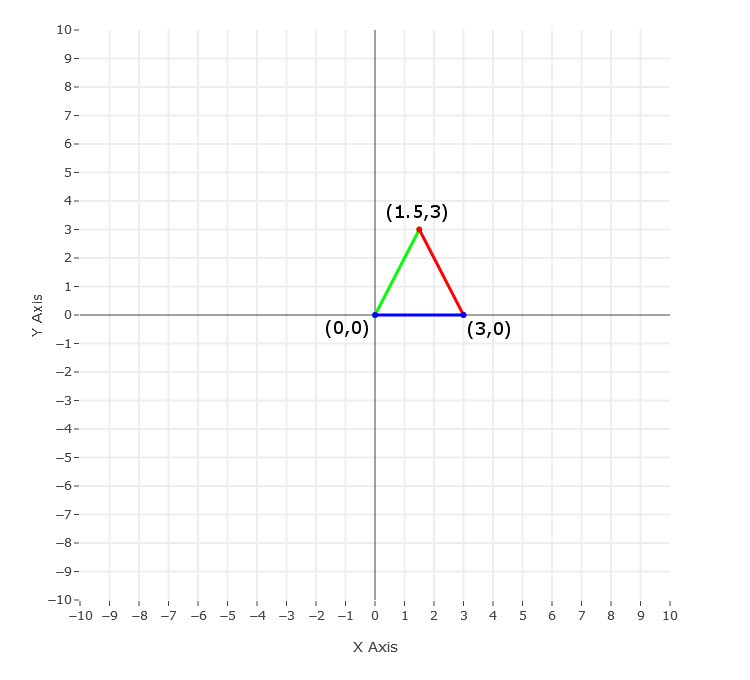
To determine how we change the coordinates of an object when the line of reflection is not at the origin we need to examine the distance between the points and the line. As an example we will look at the point (4,1) and reflect it about the line Y=3.
When we have a line at Y=3 it will be a line horizontally across going through the point (0,3) as seen in the image below.
When we reflect a point about some line the reflection will be the same distance from the line as the original point. First we need to find the distance the point is from the line. In this example the line is at Y=3 and the point is at (4,1). Since it is a horizontal line only the Y coordinates will change so the distance is then:
1 - 3 = - 2Make sure when you find the difference you subtract the coordinate of the point from the line. This shows us whether the point is above or below the line. In our example we have -2 which means it is below the line and a distance of 2 from the line.
Now that we know the distance from the line we need the reflection to be the same distance from the line but on the other side of it. Adding the distance 2, to the line to get the X coordinate of 5 is the correct coordinate of the reflection. Using the formula below uses all the steps above without you having to manually go through them.
3 - (1 - 3) = 3 - (-2) = 5The correct reflection point is then (4,5)
The formula uses the fact that when you subtract the point coordinate from the line value you get a negative number if the line is above the point and a positive value if it is below the point. Then when we subtract the line value from the value just determined and we get the reflection point coordinate correctly. If the first subtraction value was negative the reflection would be above the line so when we subtract the line value from a negative distance value it becomes a plus sign and we add it giving us the correct reflection value. In general the formula would look like:
(Line value) - (Coordinate value - Line value) = Reflection coordinate valueThe only thing you would need to determine is whether the X coordinate or the Y coordinate is changing. This depends on whether the line is vertical or horizontal.
Interactive Example
The coordinate plane below allows you to reflect the object about a line on the coordinate plane. The two drop down menus allow you to choose a vertical line to reflect the object on and to choose a horizontal line to reflect the object on. The original position of the object will remain highlighted in green and its reflection will be highlighted in blue.
square_clicked3 = True
triangle_clicked3 = False
square_button3 = widgets.Button(
description='Square',
disabled=False,
button_style='success', # 'success', 'info', 'warning', 'danger' or ''
tooltip='Click me',
)
triangle_button3 = widgets.Button(
description='Triangle',
disabled=False,
button_style='', # 'success', 'info', 'warning', 'danger' or ''
tooltip='Click me',
)
text_widget3 = widgets.HTML("<strong>Object: </strong>")
input_widget3 = widgets.HBox(children=[text_widget3, square_button3, triangle_button3])
def graph_square3():
init_notebook_mode(connected=True)
data3 = []
data3.append(dict(
visible = True,
line=dict(color='#00FF00', width=3),
mode = 'lines+markers+text',
name = 'Original',
hoverinfo = 'x+y',
text=['A','B','C','D',''],
textposition='top left',
textfont=dict(
color='#ff0000'
),
x = [1, 1, 4, 4, 1],
y = [1, 4, 4, 1, 1]))
data3.append(dict(
visible = True,
line=dict(color='#00CED1', width=3),
mode = 'lines+markers+text',
name = 'Reflection',
hoverinfo = 'x+y',
text=['A','B','C','D',''],
textposition='top left',
textfont=dict(
color='#ff0000'
),
x = [1, 1, 4, 4, 1],
y = [1, 4, 4, 1, 1]))
updatemenus=list([
dict(
buttons=list([
dict(
args=[{'x[0]': [1,1] ,'x[1]':[1,1],'x[2]':[4,4],'x[3]':[4,4],'x[4]':[1,1]}],
label='No Horizontal Reflection',
method='restyle'
),
dict(
args=[{'x[0]':[1,5-(1-5)],'x[1]':[1,5-(1-5)],'x[2]':[4,5-(4-5)],'x[3]':[4,5-(4-5)],'x[4]':[1,5-(1-5)]}],
label='Reflection about: X = 5',
method='restyle'
),
dict(
args=[{'x[0]':[1,4-(1-4)],'x[1]':[1,4-(1-4)],'x[2]':[4,4-(4-4)],'x[3]':[4,4-(4-4)],'x[4]':[1,4-(1-4)]}],
label='Reflection about: X = 4',
method='restyle'
),
dict(
args=[{'x[0]':[1,3-(1-3)],'x[1]':[1,3-(1-3)],'x[2]':[4,3-(4-3)],'x[3]':[4,3-(4-3)],'x[4]':[1,3-(1-3)]}],
label='Reflection about: X = 3',
method='restyle'
),
dict(
args=[{'x[0]':[1,2-(1-2)],'x[1]':[1,2-(1-2)],'x[2]':[4,2-(4-2)],'x[3]':[4,2-(4-2)],'x[4]':[1,2-(1-2)]}],
label='Reflection about: X = 2',
method='restyle'
),
dict(
args=[{'x[0]':[1,1-(1-1)],'x[1]':[1,1-(1-1)],'x[2]':[4,1-(4-1)],'x[3]':[4,1-(4-1)],'x[4]':[1,1-(1-1)]}],
label='Reflection about: X = 1',
method='restyle'
),
dict(
args=[{'x[0]':[1,0-(1-0)],'x[1]':[1,0-(1-0)],'x[2]':[4,0-(4-0)],'x[3]':[4,0-(4-0)],'x[4]':[1,0-(1-0)]}],
label='Reflection about: X = 0',
method='restyle'
),
dict(
args=[{'x[0]':[1,-1-(1+1)],'x[1]':[1,-1-(1+1)],'x[2]':[4,-1-(4+1)],'x[3]':[4,-1-(4+1)],'x[4]':[1,-1-(1+1)]}],
label='Reflection about: X = -1',
method='restyle'
),
dict(
args=[{'x[0]':[1,-2-(1+2)],'x[1]':[1,-2-(1+2)],'x[2]':[4,-2-(4+2)],'x[3]':[4,-2-(4+2)],'x[4]':[1,-2-(1+2)]}],
label='Reflection about: X = -2',
method='restyle'
),
dict(
args=[{'x[0]':[1,-3-(1+3)],'x[1]':[1,-3-(1+3)],'x[2]':[4,-3-(4+3)],'x[3]':[4,-3-(4+3)],'x[4]':[1,-3-(1+3)]}],
label='Reflection about: X = -3',
method='restyle'
)
]),
direction = 'down',
pad = {'r': -60, 't': -50},
showactive = True,
x = 0.1,
y = 1.1,
),
dict(
buttons=list([
dict(
args=[{'y[0]':[1,1],'y[1]':[4,4],'y[2]':[4,4],'y[3]':[1,1],'y[4]':[1,1]}],
label='No Vertical Reflection',
method='restyle'
),
dict(
args=[{'y[0]':[1,5-(1-5)],'y[1]':[4,5-(4-5)],'y[2]':[4,5-(4-5)],'y[3]':[1,5-(1-5)],'y[4]':[1,5-(1-5)]}],
label='Reflection about: Y = 5',
method='restyle'
),
dict(
args=[{'y[0]':[1,4-(1-4)],'y[1]':[4,4-(4-4)],'y[2]':[4,4-(4-4)],'y[3]':[1,4-(1-4)],'y[4]':[1,4-(1-4)]}],
label='Reflection about: Y = 4',
method='restyle'
),
dict(
args=[{'y[0]':[1,3-(1-3)],'y[1]':[4,3-(4-3)],'y[2]':[4,3-(4-3)],'y[3]':[1,3-(1-3)],'y[4]':[1,3-(1-3)]}],
label='Reflection about: Y = 3',
method='restyle'
),
dict(
args=[{'y[0]':[1,2-(1-2)],'y[1]':[4,2-(4-2)],'y[2]':[4,2-(4-2)],'y[3]':[1,2-(1-2)],'y[4]':[1,2-(1-2)]}],
label='Reflection about: Y = 2',
method='restyle'
),
dict(
args=[{'y[0]':[1,1-(1-1)],'y[1]':[4,1-(4-1)],'y[2]':[4,1-(4-1)],'y[3]':[1,1-(1-1)],'y[4]':[1,1-(1-1)]}],
label='Reflection about: Y = 1',
method='restyle'
),
dict(
args=[{'y[0]':[1,0-(1-0)],'y[1]':[4,0-(4-0)],'y[2]':[4,0-(4-0)],'y[3]':[1,0-(1-0)],'y[4]':[1,0-(1-0)]}],
label='Reflection about: Y = 0',
method='restyle'
),
dict(
args=[{'y[0]':[1,-1-(1+1)],'y[1]':[4,-1-(4+1)],'y[2]':[4,-1-(4+1)],'y[3]':[1,-1-(1+1)],'y[4]':[1,-1-(1+1)]}],
label='Reflection about: Y = -1',
method='restyle'
),
dict(
args=[{'y[0]':[1,-2-(1+2)],'y[1]':[4,-2-(4+2)],'y[2]':[4,-2-(4+2)],'y[3]':[1,-2-(1+2)],'y[4]':[1,-2-(1+2)]}],
label='Reflection about: Y = -2',
method='restyle'
),
dict(
args=[{'y[0]':[1,-3-(1+3)],'y[1]':[4,-3-(4+3)],'y[2]':[4,-3-(4+3)],'y[3]':[1,-3-(1+3)],'y[4]':[1,-3-(1+3)]}],
label='Reflection about: Y = -3',
method='restyle'
)
]),
direction = 'down',
pad = {'r': -60, 't': -15},
showactive = True,
x = 0.1,
y = 1.1,
),
])
layout3 = go.Layout(
title = 'Reflection on the Coordinate Plane',
showlegend=False,
updatemenus = updatemenus,
hovermode = 'closest',
yaxis = dict(
title= '',
ticklen= 5,
dtick= 1,
gridwidth= 2,
range=[-10,10],
showgrid=True,
),
xaxis= dict(
title= '',
ticklen= 5,
dtick=1,
gridwidth= 2,
range=[-10,10],
showgrid=True,
),
annotations=[
dict(
x=1.0,
y=-0.16,
showarrow=False,
text='X Axis',
xref='paper',
yref='paper',
font=dict(
size=14,
),
),
dict(
x=-0.06,
y=1.0,
showarrow=False,
text='Y Axis',
textangle=-90,
xref='paper',
yref='paper',
font=dict(
size=14,
),
),
],
)
fig3 = dict(data=data3, layout=layout3)
clear_output(wait=True)
display(input_widget3)
iplot(fig3, filename='basic-scatter')
def graph_triangle3():
init_notebook_mode(connected=True)
dataT3 = []
dataT3.append(dict(
visible = True,
line=dict(color='#00FF00', width=3),
mode = 'lines+markers+text',
name = 'Original',
hoverinfo = 'x+y',
text=['A','B','C',''],
textposition='top left',
textfont=dict(
color='#ff0000'
),
x = [1, 2.5, 4, 1],
y = [1, 4, 1, 1]))
dataT3.append(dict(
visible = True,
line=dict(color='#00CED1', width=3),
mode = 'lines+markers+text',
name = 'Reflection',
hoverinfo = 'x+y',
text=['A','B','C',''],
textposition='top left',
textfont=dict(
color='#ff0000'
),
x = [1, 2.5, 4, 1],
y = [1, 4, 1, 1]))
updatemenusT=list([
dict(
buttons=list([
dict(
args=[{'x[0]': [1,1] ,'x[1]':[2.5,2.5],'x[2]':[4,4],'x[3]':[1,1]}],
label='No Horizontal Reflection',
method='restyle'
),
dict(
args=[{'x[0]':[1,5-(1-5)],'x[1]':[2.5,5-(2.5-5)],'x[2]':[4,5-(4-5)],'x[3]':[1,5-(1-5)]}],
label='Reflection about: X = 5',
method='restyle'
),
dict(
args=[{'x[0]':[1,4-(1-4)],'x[1]':[2.5,4-(2.5-4)],'x[2]':[4,4-(4-4)],'x[3]':[1,4-(1-4)]}],
label='Reflection about: X = 4',
method='restyle'
),
dict(
args=[{'x[0]':[1,3-(1-3)],'x[1]':[2.5,3-(2.5-3)],'x[2]':[4,3-(4-3)],'x[3]':[1,3-(1-3)]}],
label='Reflection about: X = 3',
method='restyle'
),
dict(
args=[{'x[0]':[1,2-(1-2)],'x[1]':[2.5,2-(2.5-2)],'x[2]':[4,2-(4-2)],'x[3]':[1,2-(1-2)]}],
label='Reflection about: X = 2',
method='restyle'
),
dict(
args=[{'x[0]':[1,1-(1-1)],'x[1]':[2.5,1-(2.5-1)],'x[2]':[4,1-(4-1)],'x[3]':[1,1-(1-1)]}],
label='Reflection about: X = 1',
method='restyle'
),
dict(
args=[{'x[0]':[1,0-(1-0)],'x[1]':[2.5,0-(2.5-0)],'x[2]':[4,0-(4-0)],'x[3]':[1,0-(1-0)]}],
label='Reflection about: X = 0',
method='restyle'
),
dict(
args=[{'x[0]':[1,-1-(1+1)],'x[1]':[2.5,-1-(2.5+1)],'x[2]':[4,-1-(4+1)],'x[3]':[1,-1-(1+1)]}],
label='Reflection about: X = -1',
method='restyle'
),
dict(
args=[{'x[0]':[1,-2-(1+2)],'x[1]':[2.5,-2-(2.5+2)],'x[2]':[4,-2-(4+2)],'x[3]':[1,-2-(1+2)]}],
label='Reflection about: X = -2',
method='restyle'
),
dict(
args=[{'x[0]':[1,-3-(1+3)],'x[1]':[2.5,-3-(2.5+3)],'x[2]':[4,-3-(4+3)],'x[3]':[1,-3-(1+3)]}],
label='Reflection about: X = -3',
method='restyle'
)
]),
direction = 'down',
pad = {'r': -60, 't': -50},
showactive = True,
x = 0.1,
y = 1.1,
),
dict(
buttons=list([
dict(
args=[{'y[0]':[1,1],'y[1]':[4,4],'y[2]':[1,1],'y[3]':[1,1]}],
label='No Vertical Reflection',
method='restyle'
),
dict(
args=[{'y[0]':[1,5-(1-5)],'y[1]':[4,5-(4-5)],'y[2]':[1,5-(1-5)],'y[3]':[1,5-(1-5)]}],
label='Reflection about: Y = 5',
method='restyle'
),
dict(
args=[{'y[0]':[1,4-(1-4)],'y[1]':[4,4-(4-4)],'y[2]':[1,4-(1-4)],'y[3]':[1,4-(1-4)]}],
label='Reflection about: Y = 4',
method='restyle'
),
dict(
args=[{'y[0]':[1,3-(1-3)],'y[1]':[4,3-(4-3)],'y[2]':[1,3-(1-3)],'y[3]':[1,3-(1-3)]}],
label='Reflection about: Y = 3',
method='restyle'
),
dict(
args=[{'y[0]':[1,2-(1-2)],'y[1]':[4,2-(4-2)],'y[2]':[1,2-(1-2)],'y[3]':[1,2-(1-2)]}],
label='Reflection about: Y = 2',
method='restyle'
),
dict(
args=[{'y[0]':[1,1-(1-1)],'y[1]':[4,1-(4-1)],'y[2]':[1,1-(1-1)],'y[3]':[1,1-(1-1)]}],
label='Reflection about: Y = 1',
method='restyle'
),
dict(
args=[{'y[0]':[1,0-(1-0)],'y[1]':[4,0-(4-0)],'y[2]':[1,0-(1-0)],'y[3]':[1,0-(1-0)]}],
label='Reflection about: Y = 0',
method='restyle'
),
dict(
args=[{'y[0]':[1,-1-(1+1)],'y[1]':[4,-1-(4+1)],'y[2]':[1,-1-(1+1)],'y[3]':[1,-1-(1+1)]}],
label='Reflection about: Y = -1',
method='restyle'
),
dict(
args=[{'y[0]':[1,-2-(1+2)],'y[1]':[4,-2-(4+2)],'y[2]':[1,-2-(1+2)],'y[3]':[1,-2-(1+2)]}],
label='Reflection about: Y = -2',
method='restyle'
),
dict(
args=[{'y[0]':[1,-3-(1+3)],'y[1]':[4,-3-(4+3)],'y[2]':[1,-3-(1+3)],'y[3]':[1,-3-(1+3)]}],
label='Reflection about: Y = -3',
method='restyle'
)
]),
direction = 'down',
pad = {'r': -60, 't': -15},
showactive = True,
x = 0.1,
y = 1.1,
),
])
layoutT3 = go.Layout(
title = 'Reflection on the Coordinate Plane',
showlegend=False,
updatemenus = updatemenusT,
hovermode = 'closest',
yaxis = dict(
title= '',
ticklen= 5,
dtick= 1,
gridwidth= 2,
range=[-10,10],
showgrid=True,
),
xaxis= dict(
title= '',
ticklen= 5,
dtick=1,
gridwidth= 2,
range=[-10,10],
showgrid=True,
),
annotations=[
dict(
x=1.0,
y=-0.16,
showarrow=False,
text='X Axis',
xref='paper',
yref='paper',
font=dict(
size=14,
),
),
dict(
x=-0.06,
y=1.0,
showarrow=False,
text='Y Axis',
textangle=-90,
xref='paper',
yref='paper',
font=dict(
size=14,
),
),
],
)
figT3 = dict(data=dataT3, layout=layoutT3)
clear_output(wait=True)
display(input_widget3)
iplot(figT3, filename='basic-scatter')
def square_update3(change):
global square_clicked3
global triangle_clicked3
if(not(square_clicked3)):
square_clicked3 = True
triangle_clicked3 = False
square_button3.button_style = 'success'
triangle_button3.button_style = ''
graph_square3()
def triangle_update3(change):
global square_clicked3
global triangle_clicked3
if(not(triangle_clicked3)):
triangle_clicked3 = True
square_clicked3 = False
square_button3.button_style = ''
triangle_button3.button_style = 'success'
graph_triangle3()
square_button3.on_click(square_update3)
triangle_button3.on_click(triangle_update3)
graph_square3()
Rotations: Objects and Shapes in 2D Space
When we rotate an object or shape we are changing its coordinates based on its rotation around some point. The point an object is rotated around could be some point on the object, the origin or some random point on the coordinate plane. In this notebook the object can be rotated around a point on the object, a point at the center of the object and at the origin. The angles of rotations to be looked at will be 90°, 180°, 270° and 360° both clockwise and counter-clockwise. Other angles and points to rotate around are beyond the scope of this notebook.
90° Rotation
We will start off by showing how to rotate a point by 90° using the origin as the point of rotation. To rotate a point counter-clockwise by 90° you need to swap the current (X,Y) coordinates with each other and then multiply the new X coordinate by -1.
We start off with: (X,Y)
Swap the coordinates: (Y,X)
Then multiply the new X coordinate by -1: (-Y,X)
This will rotate any point on the coordinate plane by 90° counter-clockwise. To rotate a point clockwise by 90° you follow the same method except you multiply the new Y coordinate by -1 instead of the new X coordinate.
We start off with: (X,Y)
Swap the coordinates: (Y,X)
Then multiply the new X coordinate by -1: (Y,-X)
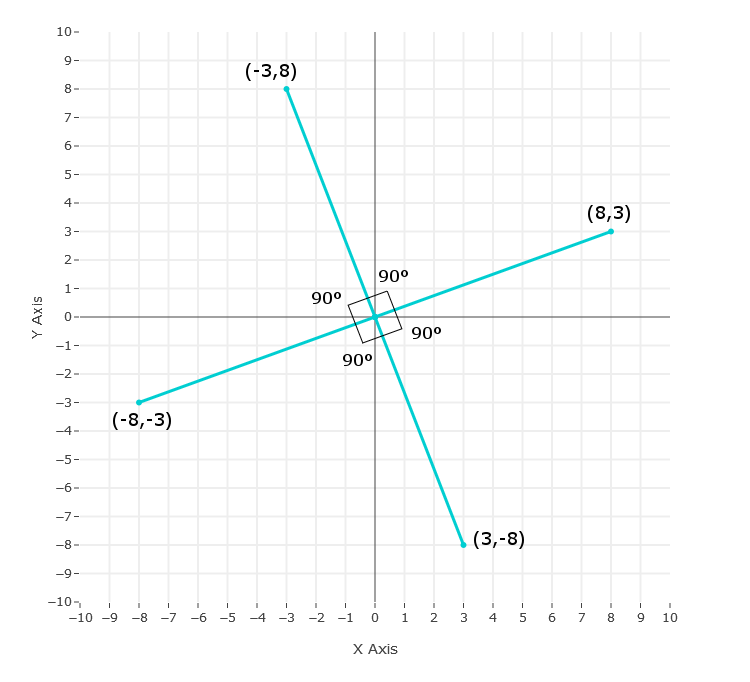
As stated above following this method will rotate any point on the coordinate plane by 90° clockwise. Let us go through an example of a 90° clockwise and counter-clockwise rotation of the point (8,3) about the origin.
For a clockwise rotation:
Original coordinates: (8,3)
Swap coordinates: (3,8)
Multiply by -1 on the Y coordinate: (3,-8)This point matches the graph below for a 90° rotation clockwise.
For a counter-clockwise rotation:
Original coordinates: (8,3)
Swap coordinates: (3,8)
Multiply by -1 on the X coordinate: (-3,8)This point matches the graph below for a 90° rotation counter-clockwise.
You can see on the graph below that this method does work clockwise and counter-clockwise as described above.
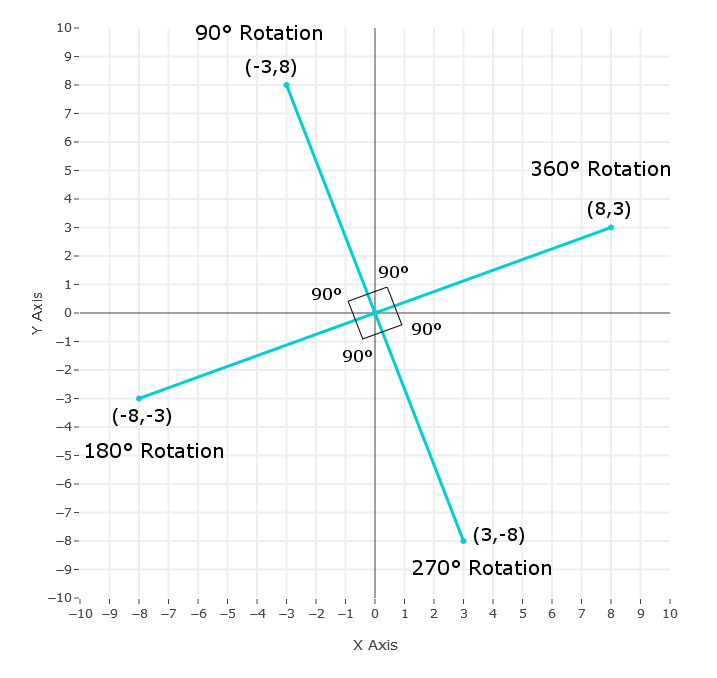
From the graph above it can be seen that you can rotate a point by 90° and then rotate the new point by 90° and you would get a 180° rotation from the original point. If you continue rotating the new points you will eventually rotate 360° and be back at the original point of 0°.
180°, 270° and 360° Rotation
You can gather from the section above that the 180°, 270° and 360° rotations are going to be using the same method in the 90° section. For 180° you will rotate the original point by 90° and then you will rotate the new point by 90° to get the coordinates for the point rotated by 180°. For 270° you will follow the same process as in the 180° but will do one more 90° rotation on the 180° point. If we wanted to do the whole 360° we would do one more 90° rotation.This process works for clockwise and counter-clockwise rotations.
You should notice here that we are using the same 90° operation multiple times to find the various rotations. This can be seen on the graph above that the point has been rotated by 90° 4 times. Using the original point as (8,3) the counter-clockwise rotations of 90°, 180°, 270° and 360° are listed on the same graph below.
Non-Origin Point of Rotation
The 90° rotation method works for any point on the coordinate plane using the origin as the point of rotation. When we have a point of rotation that is not at the origin this method won’t work unless we adjust the coordinate points.
To adjust the points so the method works we need to translate the point of rotation to the origin and then do the same translation to all other points being rotated.
For example if our point of rotation was at (1,1) we would need to translate all the points horizontally and vertically by -1 for it to be at (0,0). Now we could use the method described above to rotate the points. Once all the points have been rotated we would then do the opposite translation by translating all the points horizontally and vertically by +1 so all the points are back to their original positions.
Example
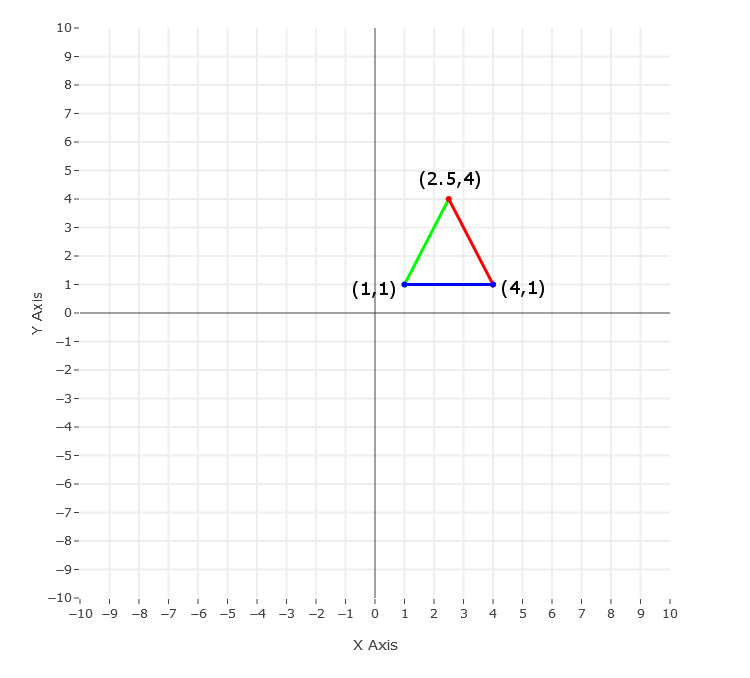
We will go through an example below rotating a triangle around one of its points at the position (1,1).
We start off with the triangle in its original position.
For the 90° rotation method to work we need to translate the point of rotation to the origin. Since we are rotating around the point (1,1) we will need to translate the triangle by -1 on the X and Y axes.
Once the point of rotation is at the origin the other points of the triangle can be rotated using the 90° rotation method. Rotating the points by 90° gives us the new coordinate points below.
As you can see on the graph above the lines connecting the points are different colors so you can see each rotation done is in fact 90°. If we rotate the new triangle position by 90° we will get the coordinates for the triangle as if it had been rotated by 180° from the original position.

Now if we rotate the 180° triangle position by 90° we will get the coordinates of the original triangle being rotated by 270°. Another 90° rotation would bring the orignal rotation to 360° which is the same as not rotating the triangle at all.
From the graph above you can see we have the rotations for the triangle of 90°, 180°, 270° and 360° clockwise and counter-clockwise. As an exercise you can test out the 90° method on the triangle points and compare them to the graph. The only thing we have left to do is to translate the triangle points back to its original position. We started off translating the points by -1 on the X and Y axes so we will need to do the opposite and translate the points by +1 on the X and Y axes.

We now have the positions of the various rotations for the triangle in their actual positions. In this example we showed the 90°, 180° and 270° rotations and then translated the points back to the original positions. As a note you don’t have to do all the rotations of the figure before you translate it back to the original position. You could do a 90° rotation clockwise or counter-clockwise and translate the points back.
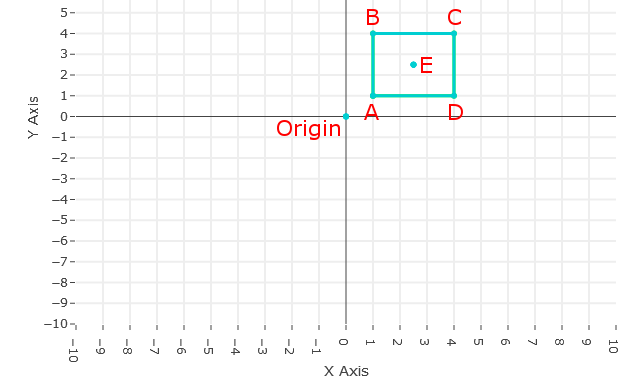
Interactive Example
In the interactive example below you can choose the Object, Rotation Direction and the Rotation Point (the point you want to rotate the object around). Your choices for the rotation point can be seen on the graph below and can be chosen from dropdown menu. You can choose to rotate the object around the origin, a point on the object or the center of the object. Once you have chosen the rotation point you can adjust the degrees of rotation from 0° to 360° clockwise or counter-clockwise using the slider on the plot. As in the examples above the green object represents the original position of the object and the rotated object will be blue.

from plotly.offline import init_notebook_mode, iplot, plot
from ipywidgets import HBox
import plotly.graph_objs as go
import numpy as np
import random
from math import radians, cos, sin, sqrt, tan, atan
import ipywidgets as widgets
from IPython.display import Markdown
from IPython.display import HTML, clear_output
init_notebook_mode(connected=True)
square_clicked4 = True
triangle_clicked4 = False
clockwise_rotation = True
counterclockwise_rotation = False
current_point = 0
square_button4 = widgets.Button(
description='Square',
disabled=False,
button_style='success', # 'success', 'info', 'warning', 'danger' or ''
tooltip='Click me',
)
triangle_button4 = widgets.Button(
description='Triangle',
disabled=False,
button_style='', # 'success', 'info', 'warning', 'danger' or ''
tooltip='Click me',
)
rotation_choice = widgets.Dropdown(
options=[('',0),('Point A', 1), ('Point B', 2), ('Point C', 3), ('Point D', 4), ('Point E', 5), ('Origin', 6)],
value=0,
description='',
)
clockwise_button = widgets.Button(
description='Clockwise',
disabled=False,
button_style='success', # 'success', 'info', 'warning', 'danger' or ''
tooltip='Click me',
)
counterclockwise_button = widgets.Button(
description='Counter-Clockwise',
disabled=False,
button_style='', # 'success', 'info', 'warning', 'danger' or ''
tooltip='Click me',
)
text_widget4 = widgets.HTML("<strong>Object: </strong>")
text2_widget4 = widgets.HTML("<strong>Rotation Direction: </strong>")
text3_widget4 = widgets.HTML("<strong>Rotation Point: </strong>")
choice_widget4 = widgets.HBox(children=[text_widget4, square_button4, triangle_button4])
rotation_widget4 = widgets.HBox(children=[text2_widget4, clockwise_button, counterclockwise_button])
point_widget4 = widgets.HBox(children=[text3_widget4, rotation_choice])
input_widget4 = widgets.VBox(children=[choice_widget4, rotation_widget4, point_widget4])
rotation_choice.layout.width = '150px'
def rotation(p):
point = p
data4 = []
data4.append(dict(
visible = True,
line=dict(color='#00FF00', width=3),
mode = 'lines+markers+text',
name = 'Original',
hoverinfo = 'x+y',
text=['A','B','C','D',''],
textposition='top left',
textfont=dict(
color='#ff0000'
),
x = [1, 1, 4, 4, 1],
y = [1, 4, 4, 1, 1]))
data4.append(dict(
visible = True,
line=dict(color='#00CED1', width=3),
mode = 'lines+markers+text',
name = 'Translation',
hoverinfo = 'x+y',
text=['A','B','C','D',''],
textposition='top left',
textfont=dict(
color='#ff0000'
),
x = [1, 1, 4, 4, 1],
y = [1, 4, 4, 1, 1]))
temp_degrees = 0
rotationX = 0
rotationY = 0
x0 = 0
x1 = 0
x2 = 0
x3 = 0
y0 = 0
y1 = 0
y2 = 0
y3 = 0
steps4 = []
steps5 = []
for i in range(37):
temp_degrees = radians((36-i)*10)
if(point == 1):
rotationX = 1
rotationY = 1
x0 = rotationX + cos(temp_degrees+1.5707963268)*(sqrt((1-rotationX)**2+(1-rotationY)**2))
y0 = rotationY + sin(temp_degrees+1.5707963268)*(sqrt((1-rotationX)**2+(1-rotationY)**2))
x1 = rotationX + cos(temp_degrees+1.5707963268)*(sqrt((1-rotationX)**2+(4-rotationY)**2))
y1 = rotationY + sin(temp_degrees+1.5707963268)*(sqrt((1-rotationX)**2+(4-rotationY)**2))
x2 = rotationX + cos(temp_degrees+atan((4-rotationY)/(4-rotationX)))*(sqrt((4-rotationX)**2+(4-rotationY)**2))
y2 = rotationY + sin(temp_degrees+atan((4-rotationY)/(4-rotationX)))*(sqrt((4-rotationX)**2+(4-rotationY)**2))
x3 = rotationX + cos(temp_degrees+atan((1-rotationY)/(4-rotationX)))*(sqrt((4-rotationX)**2+(1-rotationY)**2))
y3 = rotationY + sin(temp_degrees+atan((1-rotationY)/(4-rotationX)))*(sqrt((4-rotationX)**2+(1-rotationY)**2))
elif(point == 2):
rotationX = 1
rotationY = 4
x0 = rotationX + cos(temp_degrees-1.5707963268)*(sqrt((1-rotationX)**2+(1-rotationY)**2))
y0 = rotationY + sin(temp_degrees-1.5707963268)*(sqrt((1-rotationX)**2+(1-rotationY)**2))
x1 = rotationX + cos(temp_degrees+1.5707963268)*(sqrt((1-rotationX)**2+(4-rotationY)**2))
y1 = rotationY + sin(temp_degrees+1.5707963268)*(sqrt((1-rotationX)**2+(4-rotationY)**2))
x2 = rotationX + cos(temp_degrees+atan((4-rotationY)/(4-rotationX)))*(sqrt((4-rotationX)**2+(4-rotationY)**2))
y2 = rotationY + sin(temp_degrees+atan((4-rotationY)/(4-rotationX)))*(sqrt((4-rotationX)**2+(4-rotationY)**2))
x3 = rotationX + cos(temp_degrees+atan((1-rotationY)/(4-rotationX)))*(sqrt((4-rotationX)**2+(1-rotationY)**2))
y3 = rotationY + sin(temp_degrees+atan((1-rotationY)/(4-rotationX)))*(sqrt((4-rotationX)**2+(1-rotationY)**2))
elif(point == 3):
rotationX = 4
rotationY = 4
x0 = rotationX - cos(temp_degrees+atan((1-rotationY)/(1-rotationX)))*(sqrt((1-rotationX)**2+(1-rotationY)**2))
y0 = rotationY - sin(temp_degrees+atan((1-rotationY)/(1-rotationX)))*(sqrt((1-rotationX)**2+(1-rotationY)**2))
x1 = rotationX - cos(temp_degrees+atan((4-rotationY)/(1-rotationX)))*(sqrt((1-rotationX)**2+(4-rotationY)**2))
y1 = rotationY - sin(temp_degrees+atan((4-rotationY)/(1-rotationX)))*(sqrt((1-rotationX)**2+(4-rotationY)**2))
x2 = rotationX + cos(temp_degrees+1.5707963268)*(sqrt((4-rotationX)**2+(4-rotationY)**2))
y2 = rotationY + sin(temp_degrees+1.5707963268)*(sqrt((4-rotationX)**2+(4-rotationY)**2))
x3 = rotationX + cos(temp_degrees-1.5707963268)*(sqrt((4-rotationX)**2+(1-rotationY)**2))
y3 = rotationY + sin(temp_degrees-1.5707963268)*(sqrt((4-rotationX)**2+(1-rotationY)**2))
elif(point == 4):
rotationX = 4
rotationY = 1
x0 = rotationX - cos(temp_degrees+atan((1-rotationY)/(1-rotationX)))*(sqrt((1-rotationX)**2+(1-rotationY)**2))
y0 = rotationY - sin(temp_degrees+atan((1-rotationY)/(1-rotationX)))*(sqrt((1-rotationX)**2+(1-rotationY)**2))
x1 = rotationX - cos(temp_degrees+atan((4-rotationY)/(1-rotationX)))*(sqrt((1-rotationX)**2+(4-rotationY)**2))
y1 = rotationY - sin(temp_degrees+atan((4-rotationY)/(1-rotationX)))*(sqrt((1-rotationX)**2+(4-rotationY)**2))
x2 = rotationX + cos(temp_degrees+1.5707963268)*(sqrt((4-rotationX)**2+(4-rotationY)**2))
y2 = rotationY + sin(temp_degrees+1.5707963268)*(sqrt((4-rotationX)**2+(4-rotationY)**2))
x3 = rotationX + cos(temp_degrees+1.5707963268)*(sqrt((4-rotationX)**2+(1-rotationY)**2))
y3 = rotationY + sin(temp_degrees+1.5707963268)*(sqrt((4-rotationX)**2+(1-rotationY)**2))
elif(point == 5):
rotationX = (4-1)/2 + 1
rotationY = (4-1)/2 + 1
x0 = rotationX - cos(temp_degrees+atan((1-rotationY)/(1-rotationX)))*(sqrt((1-rotationX)**2+(1-rotationY)**2))
y0 = rotationY - sin(temp_degrees+atan((1-rotationY)/(1-rotationX)))*(sqrt((1-rotationX)**2+(1-rotationY)**2))
x1 = rotationX - cos(temp_degrees+atan((4-rotationY)/(1-rotationX)))*(sqrt((1-rotationX)**2+(4-rotationY)**2))
y1 = rotationY - sin(temp_degrees+atan((4-rotationY)/(1-rotationX)))*(sqrt((1-rotationX)**2+(4-rotationY)**2))
x2 = rotationX + cos(temp_degrees+atan((4-rotationY)/(4-rotationX)))*(sqrt((4-rotationX)**2+(4-rotationY)**2))
y2 = rotationY + sin(temp_degrees+atan((4-rotationY)/(4-rotationX)))*(sqrt((4-rotationX)**2+(4-rotationY)**2))
x3 = rotationX + cos(temp_degrees+atan((1-rotationY)/(4-rotationX)))*(sqrt((4-rotationX)**2+(1-rotationY)**2))
y3 = rotationY + sin(temp_degrees+atan((1-rotationY)/(4-rotationX)))*(sqrt((4-rotationX)**2+(1-rotationY)**2))
elif(point == 6):
rotationX = 0
rotationY = 0
tempX = rotationX + cos(temp_degrees+atan((2.5-rotationY)/(2.5-rotationX)))*(sqrt((2.5-rotationX)**2+(2.5-rotationY)**2))
tempY = rotationY + sin(temp_degrees+atan((2.5-rotationY)/(2.5-rotationX)))*(sqrt((2.5-rotationX)**2+(2.5-rotationY)**2))
x0T = tempX - 1.5
y0T = tempY - 1.5
x1T = tempX - 1.5
y1T = tempY + 1.5
x2T = tempX + 1.5
y2T = tempY + 1.5
x3T = tempX + 1.5
y3T = tempY - 1.5
rotationX = tempX
rotationY = tempY
x0 = rotationX - cos(temp_degrees+atan((y0T-rotationY)/(x0T-rotationX)))*(sqrt((x0T-rotationX)**2+(y0T-rotationY)**2))
y0 = rotationY - sin(temp_degrees+atan((y0T-rotationY)/(x0T-rotationX)))*(sqrt((x0T-rotationX)**2+(y0T-rotationY)**2))
x1 = rotationX - cos(temp_degrees+atan((y1T-rotationY)/(x1T-rotationX)))*(sqrt((x1T-rotationX)**2+(y1T-rotationY)**2))
y1 = rotationY - sin(temp_degrees+atan((y1T-rotationY)/(x1T-rotationX)))*(sqrt((x1T-rotationX)**2+(y1T-rotationY)**2))
x2 = rotationX + cos(temp_degrees+atan((y2T-rotationY)/(x2T-rotationX)))*(sqrt((x2T-rotationX)**2+(y2T-rotationY)**2))
y2 = rotationY + sin(temp_degrees+atan((y2T-rotationY)/(x2T-rotationX)))*(sqrt((x2T-rotationX)**2+(y2T-rotationY)**2))
x3 = rotationX + cos(temp_degrees+atan((y3T-rotationY)/(x3T-rotationX)))*(sqrt((x3T-rotationX)**2+(y3T-rotationY)**2))
y3 = rotationY + sin(temp_degrees+atan((y3T-rotationY)/(x3T-rotationX)))*(sqrt((x3T-rotationX)**2+(y3T-rotationY)**2))
step = dict(
method = 'update',
args = [{'x[0]':[1,x0],'x[1]':[1,x1],'x[2]':[4,x2],'x[3]':[4,x3],'x[4]':[1,x0],'y[0]':[1,y0],'y[1]':[4,y1],'y[2]':[4,y2],'y[3]':[1,y3],'y[4]':[1,y0]}],
label = str(i*10) + "°"
)
steps4.append(step)
step2 = dict(
method = 'update',
args = [{'x[0]':[1,x0],'x[1]':[1,x1],'x[2]':[4,x2],'x[3]':[4,x3],'x[4]':[1,x0],'y[0]':[1,y0],'y[1]':[4,y1],'y[2]':[4,y2],'y[3]':[1,y3],'y[4]':[1,y0]}],
label = str((36-i)*10) + "°"
)
steps5.insert(0,step2)
if(clockwise_rotation):
sliders4 = [dict(
active = 0,
currentvalue = {"prefix": "Clockwise Rotation: ", },
pad = {"t": 35},
steps = steps4
)]
else:
sliders4 = [dict(
active = 0,
currentvalue = {"prefix": "Counter-Clockwise Rotation: ", },
pad = {"t": 35},
steps = steps5
)]
title = ''
if(point == 1):
title = 'Rotation about Point A'
elif(point == 2):
title = 'Rotation about Point B'
elif(point == 3):
title = 'Rotation about Point C'
elif(point == 4):
title = 'Rotation about Point D'
elif(point == 5):
title = 'Rotation about Point E'
elif(point == 6):
title = 'Rotation about the Origin'
layout4 = go.Layout(
title = title,
sliders=sliders4,
showlegend=False,
hovermode = 'closest',
yaxis = dict(
title= '',
ticklen= 5,
dtick= 1,
gridwidth= 2,
range=[-10,10],
showgrid=True,
),
xaxis= dict(
title= '',
ticklen= 5,
dtick=1,
gridwidth= 2,
range=[-10,10],
showgrid=True,
),
autosize=True,
#width=750,
height=725,
annotations=[
dict(
x=1.0,
y=-0.10,
showarrow=False,
text='X Axis',
xref='paper',
yref='paper',
font=dict(
size=14,
),
),
dict(
x=-0.06,
y=1.0,
showarrow=False,
text='Y Axis',
textangle=-90,
xref='paper',
yref='paper',
font=dict(
size=14,
),
),
],
)
fig4 = dict(data=data4, layout=layout4)
# if(not(point == 0)):
clear_output(wait=True)
display(Markdown("<img src='images/pointplot2.png' align='left'>"))
display(input_widget4)
iplot(fig4, filename = 'filename')
def rotationT(p):
pointT = p
dataT4 = []
dataT4.append(dict(
visible = True,
line=dict(color='#00FF00', width=3),
mode = 'lines+markers+text',
name = 'Original',
hoverinfo = 'x+y',
text=['A','B','C',''],
textposition='top left',
textfont=dict(
color='#ff0000'
),
x = [1, 2.5, 4, 1],
y = [1, 4, 1, 1]))
dataT4.append(dict(
visible = True,
line=dict(color='#00CED1', width=3),
mode = 'lines+markers+text',
name = 'Rotation',
hoverinfo = 'x+y',
text=['A','B','C',''],
textposition='top left',
textfont=dict(
color='#ff0000'
),
x = [1, 2.5, 4, 1],
y = [1, 4, 1, 1]))
temp_degrees = 0
rotationX = 0
rotationY = 0
xT0 = 0
xT1 = 0
xT2 = 0
yT0 = 0
yT1 = 0
yT2 = 0
stepsT4 = []
stepsT5 = []
for i in range(37):
temp_degrees = radians((36-i)*10)
if(pointT == 1):
rotationX = 1
rotationY = 1
xT0 = rotationX + cos(temp_degrees+1.5707963268)*(sqrt((1-rotationX)**2+(1-rotationY)**2))
yT0 = rotationY + sin(temp_degrees+1.5707963268)*(sqrt((1-rotationX)**2+(1-rotationY)**2))
xT1 = rotationX + cos(temp_degrees+atan((4-rotationY)/(2.5-rotationX)))*(sqrt((2.5-rotationX)**2+(4-rotationY)**2))
yT1 = rotationY + sin(temp_degrees+atan((4-rotationY)/(2.5-rotationX)))*(sqrt((2.5-rotationX)**2+(4-rotationY)**2))
xT2 = rotationX + cos(temp_degrees+atan((1-rotationY)/(4-rotationX)))*(sqrt((4-rotationX)**2+(1-rotationY)**2))
yT2 = rotationY + sin(temp_degrees+atan((1-rotationY)/(4-rotationX)))*(sqrt((4-rotationX)**2+(1-rotationY)**2))
elif(pointT == 2):
rotationX = 2.5
rotationY = 4
xT0 = rotationX - cos(temp_degrees+atan((1-rotationY)/(1-rotationX)))*(sqrt((1-rotationX)**2+(1-rotationY)**2))
yT0 = rotationY - sin(temp_degrees+atan((1-rotationY)/(1-rotationX)))*(sqrt((1-rotationX)**2+(1-rotationY)**2))
xT1 = rotationX + cos(temp_degrees+1.5707963268)*(sqrt((2.5-rotationX)**2+(4-rotationY)**2))
yT1 = rotationY + sin(temp_degrees+1.5707963268)*(sqrt((2.5-rotationX)**2+(4-rotationY)**2))
xT2 = rotationX + cos(temp_degrees+atan((1-rotationY)/(4-rotationX)))*(sqrt((4-rotationX)**2+(1-rotationY)**2))
yT2 = rotationY + sin(temp_degrees+atan((1-rotationY)/(4-rotationX)))*(sqrt((4-rotationX)**2+(1-rotationY)**2))
elif(pointT == 3):
rotationX = 4
rotationY = 1
xT0 = rotationX - cos(temp_degrees+atan((1-rotationY)/(1-rotationX)))*(sqrt((1-rotationX)**2+(1-rotationY)**2))
yT0 = rotationY - sin(temp_degrees+atan((1-rotationY)/(1-rotationX)))*(sqrt((1-rotationX)**2+(1-rotationY)**2))
xT1 = rotationX - cos(temp_degrees+atan((4-rotationY)/(2.5-rotationX)))*(sqrt((2.5-rotationX)**2+(4-rotationY)**2))
yT1 = rotationY - sin(temp_degrees+atan((4-rotationY)/(2.5-rotationX)))*(sqrt((2.5-rotationX)**2+(4-rotationY)**2))
xT2 = rotationX + cos(temp_degrees+1.5707963268)*(sqrt((4-rotationX)**2+(1-rotationY)**2))
yT2 = rotationY + sin(temp_degrees+1.5707963268)*(sqrt((4-rotationX)**2+(1-rotationY)**2))
elif(pointT == 4):
rotationX = (4-1)/2 + 1
rotationY = (4-1)/2 + 1
xT0 = rotationX - cos(temp_degrees+atan((1-rotationY)/(1-rotationX)))*(sqrt((1-rotationX)**2+(1-rotationY)**2))
yT0 = rotationY - sin(temp_degrees+atan((1-rotationY)/(1-rotationX)))*(sqrt((1-rotationX)**2+(1-rotationY)**2))
xT1 = rotationX + cos(temp_degrees+1.5707963268)*(sqrt((2.5-rotationX)**2+(4-rotationY)**2))
yT1 = rotationY + sin(temp_degrees+1.5707963268)*(sqrt((2.5-rotationX)**2+(4-rotationY)**2))
xT2 = rotationX + cos(temp_degrees+atan((1-rotationY)/(4-rotationX)))*(sqrt((4-rotationX)**2+(1-rotationY)**2))
yT2 = rotationY + sin(temp_degrees+atan((1-rotationY)/(4-rotationX)))*(sqrt((4-rotationX)**2+(1-rotationY)**2))
elif(pointT == 5):
rotationX = 0
rotationY = 0
tempTX = rotationX + cos(temp_degrees+atan((2.5-rotationY)/(2.5-rotationX)))*(sqrt((2.5-rotationX)**2+(2.5-rotationY)**2))
tempTY = rotationY + sin(temp_degrees+atan((2.5-rotationY)/(2.5-rotationX)))*(sqrt((2.5-rotationX)**2+(2.5-rotationY)**2))
xT0T = tempTX - 1.5
yT0T = tempTY - 1.5
xT1T = tempTX
yT1T = tempTY + 1.5
xT2T = tempTX + 1.5
yT2T = tempTY - 1.5
rotationX = tempTX
rotationY = tempTY
xT0 = rotationX - cos(temp_degrees+atan((yT0T-rotationY)/(xT0T-rotationX)))*(sqrt((xT0T-rotationX)**2+(yT0T-rotationY)**2))
yT0 = rotationY - sin(temp_degrees+atan((yT0T-rotationY)/(xT0T-rotationX)))*(sqrt((xT0T-rotationX)**2+(yT0T-rotationY)**2))
xT1 = rotationX + cos(temp_degrees+1.5707963268)*(sqrt((xT1T-rotationX)**2+(yT1T-rotationY)**2))
yT1 = rotationY + sin(temp_degrees+1.5707963268)*(sqrt((xT1T-rotationX)**2+(yT1T-rotationY)**2))
xT2 = rotationX + cos(temp_degrees+atan((yT2T-rotationY)/(xT2T-rotationX)))*(sqrt((xT2T-rotationX)**2+(yT2T-rotationY)**2))
yT2 = rotationY + sin(temp_degrees+atan((yT2T-rotationY)/(xT2T-rotationX)))*(sqrt((xT2T-rotationX)**2+(yT2T-rotationY)**2))
step = dict(
method = 'update',
args = [{'x[0]':[1,xT0],'x[1]':[2.5,xT1],'x[2]':[4,xT2],'x[3]':[1,xT0],'y[0]':[1,yT0],'y[1]':[4,yT1],'y[2]':[1,yT2],'y[3]':[1,yT0]}],
label = str(i*10) + "°"
)
stepsT4.append(step)
step2 = dict(
method = 'update',
args = [{'x[0]':[1,xT0],'x[1]':[2.5,xT1],'x[2]':[4,xT2],'x[3]':[1,xT0],'y[0]':[1,yT0],'y[1]':[4,yT1],'y[2]':[1,yT2],'y[3]':[1,yT0]}],
label = str((36-i)*10) + "°"
)
stepsT5.insert(0,step2)
if(clockwise_rotation):
slidersT4 = [dict(
active = 0,
currentvalue = {"prefix": "Clockwise Rotation: ", },
pad = {"t": 35},
steps = stepsT4
)]
else:
slidersT4 = [dict(
active = 0,
currentvalue = {"prefix": "Counter-Clockwise Rotation: ", },
pad = {"t": 35},
steps = stepsT5
)]
title = ''
if(pointT == 1):
title = 'Rotation about Point A'
elif(pointT == 2):
title = 'Rotation about Point B'
elif(pointT == 3):
title = 'Rotation about Point C'
elif(pointT == 4):
title = 'Rotation about Point D'
elif(pointT == 5):
title = 'Rotation about the Origin'
layoutT4 = go.Layout(
title = title,
sliders=slidersT4,
showlegend=False,
hovermode = 'closest',
yaxis = dict(
title= '',
ticklen= 5,
dtick= 1,
gridwidth= 2,
range=[-10,10],
showgrid=True,
),
xaxis= dict(
title= '',
ticklen= 5,
dtick=1,
gridwidth= 2,
range=[-10,10],
showgrid=True,
),
autosize=True,
#width=750,
height=725,
annotations=[
dict(
x=1.0,
y=-0.10,
showarrow=False,
text='X Axis',
xref='paper',
yref='paper',
font=dict(
size=14,
),
),
dict(
x=-0.06,
y=1.0,
showarrow=False,
text='Y Axis',
textangle=-90,
xref='paper',
yref='paper',
font=dict(
size=14,
),
),
],
)
figT4 = dict(data=dataT4, layout=layoutT4)
# if(not(pointT == 0)):
clear_output(wait=True)
display(Markdown("<img src='images/pointplot4.png' align='left'>"))
display(input_widget4)
iplot(figT4, filename = 'filename')
def graph_rotation(change):
global current_point
current_point = change.new
if(square_clicked4):
rotation(change.new)
elif(triangle_clicked4):
rotationT(change.new)
def square_update4(change):
global square_clicked4
global triangle_clicked4
if(not(square_clicked4)):
square_clicked4 = True
triangle_clicked4 = False
square_button4.button_style = 'success'
triangle_button4.button_style = ''
rotation_choice.options = [('',0),('Point A', 1), ('Point B', 2), ('Point C', 3), ('Point D', 4), ('Point E', 5), ('Origin', 6)]
rotation_choice.value = 0
clear_output(wait=True)
display(Markdown("<img src='images/pointplot2.png' align='left'>"))
display(input_widget4)
def triangle_update4(change):
global square_clicked4
global triangle_clicked4
if(not(triangle_clicked4)):
triangle_clicked4 = True
square_clicked4 = False
square_button4.button_style = ''
triangle_button4.button_style = 'success'
rotation_choice.options = options=[('',0),('Point A', 1), ('Point B', 2), ('Point C', 3), ('Point D', 4), ('Origin', 5)]
rotation_choice.value = 0
clear_output(wait=True)
display(Markdown("<img src='images/pointplot4.png' align='left'>"))
display(input_widget4)
def clockwise_update(change):
global clockwise_rotation
global counterclockwise_rotation
global current_point
if(not(clockwise_rotation)):
clockwise_rotation = True
counterclockwise_rotation = False
clockwise_button.button_style = "success"
counterclockwise_button.button_style = ""
clear_output(wait=True)
if(square_clicked4):
display(Markdown("<img src='images/pointplot2.png' align='left'>"))
if(current_point == 0):
display(input_widget4)
rotation(current_point)
else:
display(Markdown("<img src='images/pointplot4.png' align='left'>"))
if(current_point == 0):
display(input_widget4)
rotationT(current_point)
def counterclockwise_update(change):
global clockwise_rotation
global counterclockwise_rotation
global current_point
if(not(counterclockwise_rotation)):
clockwise_rotation = False
counterclockwise_rotation = True
clockwise_button.button_style = ""
counterclockwise_button.button_style = "success"
clear_output(wait=True)
if(square_clicked4):
display(Markdown("<img src='images/pointplot2.png' align='left'>"))
if(current_point == 0):
display(input_widget4)
rotation(current_point)
else:
display(Markdown("<img src='images/pointplot4.png' align='left'>"))
if(current_point == 0):
display(input_widget4)
rotationT(current_point)
square_button4.on_click(square_update4)
triangle_button4.on_click(triangle_update4)
clockwise_button.on_click(clockwise_update)
counterclockwise_button.on_click(counterclockwise_update)
rotation_choice.observe(graph_rotation, names='value')
clear_output(wait=True)
#display(Markdown("<img src='images/pointplot2.png' align='left'>"))
display(input_widget4)
rotation(0)
Conclusion
In this notebook we have covered the topic of transformations of an object in a 2-Dimensional coordinate plane. We examined how to do Translations, Reflections and Rotations of objects on a coordinate plane and provided multiple interactive examples for the reader. Once the reader has gone through each section and looked at all the interactive examples they will good understanding of transformations on a 2-D coordinate plane and will be able to do the exercises in the Exercises - Transformations of Objects and Shapes notebook. In future courses and notebooks the reader will be introduced to more complex translations, reflections and rotations in both 2-D and 3-D coordinate planes.
