

![]()
%%html

<script>
  function code_toggle() {
    if (code_shown){
      $('div.input').hide('500');
      $('#toggleButton').val('Show Code')
    } else {
      $('div.input').show('500');
      $('#toggleButton').val('Hide Code')
    }
    code_shown = !code_shown
  }

  $( document ).ready(function(){
    code_shown=false;
    $('div.input').hide()
  });
</script>
<p> Code is hidden for ease of viewing. Click the Show/Hide button to see. </>
<form action="javascript:code_toggle()"><input type="submit" id="toggleButton" value="Show Code"></form>
Code is hidden for ease of viewing. Click the Show/Hide button to see.
# Modules

import string
import numpy as np
import pandas as pd
import qgrid as q
import matplotlib.pyplot as plt

# Widgets & Display modules, etc..

from ipywidgets import widgets as w
from ipywidgets import Button, Layout, widgets
from IPython.display import display, Javascript, Markdown, HTML

# grid features for interactive grids

grid_features = { 'fullWidthRows': True,
                  'syncColumnCellResize': True,
                  'forceFitColumns': True,
                  'rowHeight': 40,
                  'enableColumnReorder': True,
                  'enableTextSelectionOnCells': True,
                  'editable': True,
                  'filterable': False,
                  'sortable': False,
                  'highlightSelectedRow': True}
from ipywidgets import Button , Layout , interact,widgets
from IPython.display import Javascript, display

# Function: executes previous cell on button widget click event and hides achievement indicators message

def run_current(ev):

    display(Javascript('IPython.notebook.execute_cell_range(IPython.notebook.get_selected_index()+0,IPython.notebook.get_selected_index()+1)'))

# Counter for toggling achievement indicator on/off

button_ctr = 0

# Achievement Indicators

line_1 = "#### Achievement Indicators"
line_2 = "**General Outcome: **"
line_3 = "* Create a table of values from a linear relation, graph the table of values, and analyze the graph to draw conclusions and solve problems"

# Use to print lines, then save in lines_list

def print_lines(n):

    lines_str = ""

    for i in range(1,n+1):
        lines_str = lines_str + "line_"+str(i)+","

    lines_str = lines_str[:-1]

    print(lines_str)

lines_list = [line_1,line_2,line_3]

# Show/Hide buttons

ai_button_show = widgets.Button(button_style='info',description="Show Achievement Indicators", layout=Layout(width='25%', height='30px') )
ai_button_hide = widgets.Button(button_style='info',description="Hide Achievement Indicators", layout=Layout(width='25%', height='30px') )

display(Markdown("For instructors:"))
For instructors:
button_ctr += 1

if(button_ctr % 2 == 0):

    for line in lines_list:
        display(Markdown(line))

    display(ai_button_hide)
    ai_button_hide.on_click( run_current )

else:

    display(ai_button_show)
    ai_button_show.on_click( run_current )
# Import libraires
import matplotlib.pyplot as plt
import pandas as pd
import numpy as np
import operator
import qgrid as q
from ipywidgets import widgets
from ipywidgets import Button, Layout,interact_manual,interact
from IPython.display import display, Javascript, Markdown
import numpy as np
from mpl_toolkits.mplot3d import Axes3D
from ipywidgets import widgets as w
from ipywidgets import Button, Layout
from IPython.display import display, Javascript, Markdown
Patterns and Relations
Grade 7 Math
Introduction
In this notebook we will learn what an ordered pair is and how we can use a table of values to represent them. We will work with simple linear equations (relations) and tabulate values for them.
We will also learn what a plane and coordinate plane are and explore the relationship between an equation and a coordinate plane is.
We will then have an opportunity to practice the concepts we learned via a set of exercises that will help us build and plot a few points for a given linear relation.
This notebook is one in a series of notebooks that explore the use patterns to describe the world and to solve problems. Please refer to notebook CC-63 for specific outcome 1.
We begin with a few definitions.
For example, the pair (1,2) is different from the pair (2,1).
For example,
\(y = x + 2\)
\(y = 3x\)
\(y = 2\)
are all equations.
For example,
a |
b |
Linear Relation |
|---|---|---|
1 |
2 |
y = x + 2 |
3 |
1 |
y = 3x + 1 |
5 |
0 |
y = 5x |
0 |
0 |
y = 0 |
For example, if we consider the equation
and the values \(x = 1,2,3\), the table of values corresponds to
Value for x |
Value for y |
Ordered Pair (x,y) |
|---|---|---|
1 |
2 |
(1,2) |
2 |
3 |
(2,3) |
3 |
4 |
(3,4) |
Let us illustrate this with an example you can interact with.
Interactive Example: Generating a table of values from a linear relation
Let us take the relation
and suppose that \(x\) is an integer. We can then obtain different values for \(y\), depending on the value of \(x\).
Then, if we consider the following values for x:
x = |
0 |
1 |
We can substitute each in the equation to obtain a new value of y.
Activity
Let us try all entries to illustrate. Using the widget below change the value of \(x\). What is the value for \(y\) as \(x\) changes?
%matplotlib inline
style = {'description_width': 'initial'}
@interact(x_value=widgets.IntSlider(value=0,
            min=0,
            max=5,
            step=1,
            description='Value for x',
            disabled=False,
            continuous_update=False,
            orientation='horizontal',
            readout=True,
            readout_format='d',
            style =style
))

def plug_and_play(x_value):
    fig = plt.figure(figsize=(16,5))

    ax1 = fig.add_subplot(1, 3, 1)
    ax2 = fig.add_subplot(1, 3, 2)
    ax3 = fig.add_subplot(1, 3, 3)

    ax1.text(0.4,0.5,"x = " + str(x_value),fontsize=30)
    ax2.text(0.34,0.7,"y = x + 3",fontsize=30)
    ax2.text(0.34,0.5,"y =" + str(x_value) + " + 3",fontsize=30)
    ax2.text(0.34,0.3,"y =" + str(x_value + 3),fontsize=30)
    ax3.text(0.4,0.5,"(" + str(x_value) + "," + str(x_value + 3) + ")",fontsize=30)
    ax1.set_title("Value for x",fontsize=30)
    ax2.set_title("Value for y",fontsize=30)
    ax3.set_title("Ordered Pair",fontsize=30)
    ax1.set_xticklabels([]),ax1.set_yticklabels([])
    ax2.set_xticklabels([]),ax2.set_yticklabels([])
    ax3.set_xticklabels([]),ax3.set_yticklabels([])
    ax1.axis("Off"),ax2.axis("Off"),ax3.axis("Off")
    plt.show()
Question
Knowing that the linear relation is \(y = x + 3\), what is the value for y, when \(x = 2\)? Use the widget above to help you find the answer.
s = {'description_width': 'initial'}

from ipywidgets import interact_manual
def question_q(answer):
    if answer=="Select option":
        print("Click on the correct value for y.")

    elif answer=="5":
        ret="Correct!"
        return ret
    elif answer != "5" or answer != "Select Option":
        ret = "Not quite.Recall y = x + 3. We know x = 2. What does 2 + 3 equal to?"
        return ret
answer_q = interact(question_q,answer=widgets.Select(
                    options=["Select option","2",\
                            "10","3",\
                             "5"],
                    value='Select option',
                    description="y value",
                    disabled=False,
                    style=s
))
Question
Using the correct answer above, what is the corresponding ordered pair? Recall that an ordered pair is of the form \((x,y)\).
s = {'description_width': 'initial'}

from ipywidgets import interact_manual
def question_q(answer):
    if answer=="Select option":
        print("Click on the correct ordered pair (x,y).")

    elif answer=="(2,5)":
        ret="Correct!"
        return ret
    elif answer != "(2,5)" or answer != "Select Option":
        ret = "Not quite.Recall x = 2, y = 5. The correct ordered pair is of the form (x,y)."
        return ret
answer_q = interact(question_q,answer=widgets.Select(
                    options=["Select option","(2,5)",\
                            "(2,1)","(5,2)",\
                             "(5,3)"],
                    value='Select option',
                    description="Ordered pair (x,y)",
                    disabled=False,
                    style=s
))
Memorizing all different values for \(x\) and \(y\) is unnecessary.
We can organize the \(x,y\) values along with the corresponding pairs \((x,y)\) in a table as follows.
### Create dataframe

#df_num_rows = int(dropdown_widget.value)

grid_features = { 'fullWidthRows': False,
                  'syncColumnCellResize': True,
                  'forceFitColumns': True,
                  'rowHeight': 40,
                  'enableColumnReorder': True,
                  'enableTextSelectionOnCells': True,
                  'editable': False,
                  'filterable': False,
                  'sortable': False,
                  'highlightSelectedRow': True}


# Set up data input for dataframe

x_values = np.array([0,1,2,3,4])
y_values = x_values + 3
ordered = [(x_values[i],y_values[i]) for i in range(len(x_values))]
y_equals = ["y = " + str(x_values[i]) + "+3" for i in range(len(x_values))]


df_num_rows = len(x_values)
empty_list = [ '' for i in range(df_num_rows) ]
category_list = [ i+1 for i in range(df_num_rows) ]


df_dict = {'Entry Number':category_list,\
           'Values for x': empty_list, 'y = x + 3':empty_list,'Values for y': empty_list,\
          'Ordered pairs': empty_list}
feature_list = ['Entry Number','Values for x','y = x + 3','Values for y','Ordered pairs']
student_df = pd.DataFrame(data = df_dict,columns=feature_list)

student_df.set_index('Entry Number',inplace=True)
student_df["Values for y"] = y_values
student_df["Values for x"] = x_values
student_df["y = x + 3"] = y_equals
student_df["Ordered pairs"] = ordered

# Set up & display as Qgrid
q_student_df = q.show_grid( student_df , grid_options = grid_features )
display(q_student_df)
Once we compute a few ordered pairs, we can represent them visually. We define the following two concepts.
point  = np.array([1, 1, 1])
normal = np.array([0, 0, 1])

# a plane is a*x+b*y+c*z+d=0
# [a,b,c] is the normal. Thus, we have to calculate
# d and we're set
d = -point.dot(normal)

# create x,y
xx, yy = np.meshgrid(range(10), range(10))

# calculate corresponding z
z = (-normal[0] * xx - normal[1] * yy - d) * 1. /normal[2]

# plot the surface
plt3d = plt.figure(figsize=(15,10)).gca(projection='3d')


plt3d.plot_surface(xx, yy, z,color="#518900",edgecolor="white")
plt3d.grid(False)
plt3d.axis("Off")
plt.show()

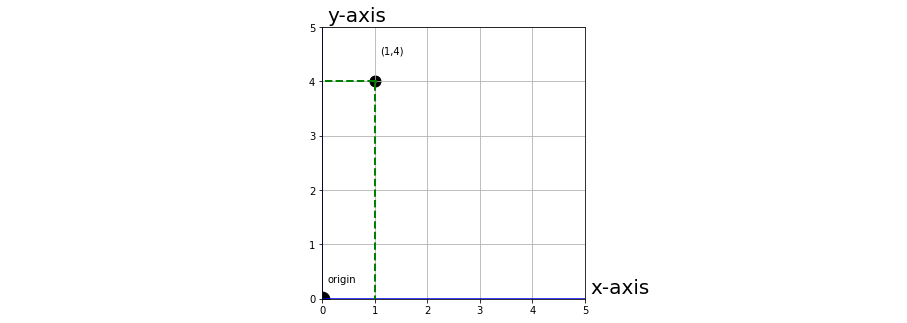
We can plot points on the coordinate plane. We use ordered pairs to encode information on where points are located.
Recall that an ordered pair is of the form \((x,y)\). The first entry on the pair denotes how far from the origin along the x-axis the point is, the second entry denotes how far from the origin along the y-axis the point is.
Let’s see a simple example for the ordered pair \((1,4)\).
fig = plt.figure(figsize=(16,5))
ax1 = fig.add_subplot(1, 3, 1)
ax2 = fig.add_subplot(1, 3, 2)
ax3 = fig.add_subplot(1, 3, 3)
ax2.set_xticks(np.arange(-5,6)),ax2.set_yticks(np.arange(-5,6))
ax2.set_xlim(0,5)
ax2.set_ylim(0,5)
ax1.axis("Off"),ax2.axis("On"),ax3.axis("Off")
ax2.axhline(y=0, color='blue')
ax2.axvline(x=0, color='blue')
ax2.text(5.1,0.1,"x-axis",fontsize=20)
ax2.text(0.1,5.1,"y-axis",fontsize=20)
ax2.grid(True)
x_value,y_value = 1,4
x_or,y_or = 0,0
ax2.scatter(x_value,y_value,color="black",s=120)
ax2.scatter(x_or,y_or,color="black",s=220)
ax2.text(x_value + 0.1,y_value + 0.5,"(" +str(x_value) + "," + str(y_value)  +  ")")
ax2.text(x_or + 0.1,y_or + 0.3,"origin")

ax2.plot([-5,x_value], [y_value,y_value], color='green', marker='o', linestyle='dashed',
        linewidth=2, markersize=2)
ax2.plot([x_value,x_value], [-5,y_value], color='green', marker='o', linestyle='dashed',
        linewidth=2, markersize=2)
plt.show()
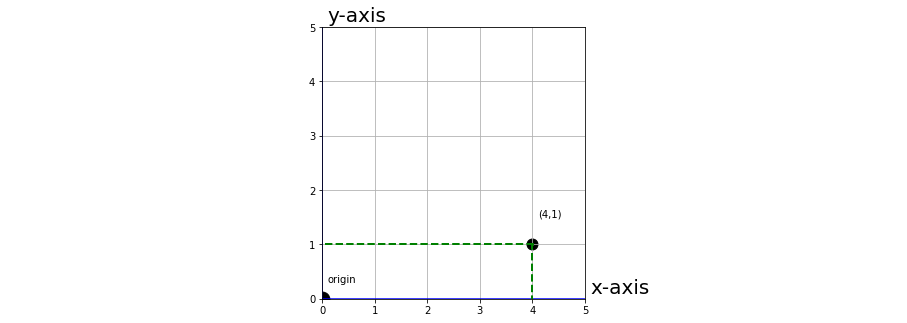
Notice why the order matters. Indeed, if we consider the pair \((4,1)\) we see that it is different.
fig = plt.figure(figsize=(16,5))
ax1 = fig.add_subplot(1, 3, 1)
ax2 = fig.add_subplot(1, 3, 2)
ax3 = fig.add_subplot(1, 3, 3)
ax2.set_xticks(np.arange(-5,6)),ax2.set_yticks(np.arange(-5,6))
ax2.set_xlim(0,5)
ax2.set_ylim(0,5)
ax1.axis("Off"),ax2.axis("On"),ax3.axis("Off")
ax2.axhline(y=0, color='blue')
ax2.axvline(x=0, color='blue')
ax2.text(5.1,0.1,"x-axis",fontsize=20)
ax2.text(0.1,5.1,"y-axis",fontsize=20)
ax2.grid(True)
x_value,y_value = 4,1
x_or,y_or = 0,0
ax2.scatter(x_value,y_value,color="black",s=120)
ax2.scatter(x_or,y_or,color="black",s=220)
ax2.text(x_value + 0.1,y_value + 0.5,"(" +str(x_value) + "," + str(y_value)  +  ")")
ax2.text(x_or + 0.1,y_or + 0.3,"origin")

ax2.plot([-5,x_value], [y_value,y_value], color='green', marker='o', linestyle='dashed',
        linewidth=2, markersize=2)
ax2.plot([x_value,x_value], [-5,y_value], color='green', marker='o', linestyle='dashed',
        linewidth=2, markersize=2)
plt.show()
Let us take the table we computed previously for the relation
along with the ordered pairs we computed.
We can then represent the ordered pairs in the coordinate plane.
Activity
Use the widget below to see the relationship between the different ordered pairs and the points on the coordinate plane.
%matplotlib inline
@interact(x_value=widgets.IntSlider(value=0,
            min=0,
            max=5,
            step=1,
            description='Value for x',
            disabled=False,
            continuous_update=False,
            orientation='horizontal',
            readout=True,
            readout_format='d',
            style =style
))


def show_points(x_value):
    x_values = np.array([0,1,2,3,4,5])
    y_values = x_values + 3

    fig = plt.figure()
    plt.subplots_adjust(left=14, bottom=0.2, right=16, top=1.5,
                wspace=0.1, hspace=0.2)
    ax1 = fig.add_subplot(1, 2, 1)


    ax1.text(0.1,0.8,"x = " + str(x_value),fontsize=20)
    ax1.text(0.1,0.6,"y = " + str(x_value) +"+ 3 = "  + str(x_value + 3),fontsize=20)
    ax1.text(0.1,0.4,"Ordered pair (" + str(x_value) +","  + str(x_value + 3) + ")",fontsize=20)
    ax1.set_title("Values for x and y", fontsize=25)
    ax2 = fig.add_subplot(1, 2, 2)
    ax2.set_xticks(np.arange(-6,11)),ax2.set_yticks(np.arange(-6,11))
    ax2.set_xlim(0,6)
    ax2.set_ylim(0,9)
    ax1.axis("Off"),ax2.axis("On")
    ax2.axhline(y=0, color='blue')
    ax2.axvline(x=0, color='blue')
    ax2.text(6.5,0.2,"x-axis",fontsize=20)
    ax2.text(0.5,9.5,"y-axis",fontsize=20)
    ax2.grid(True)
# for i in range(len(x_values)):
#     ax2.text(x_values[i] - 0.5,y_values[i]-0.7,"(" + str(x_values[i]) + "," + str(y_values[i]) + ")")
    points = ax2.scatter(x_values,y_values,color="black",s=60)
    ax2.scatter(x_value,x_value + 3,color="red",s=120)
    #datacursor(points)

    plt.show()
Conclusion
From this graph we conclude that the relation between \(x\) and \(y\) is linear. This makes sense given the equation is of the form
where \(a,b\) are integers and in this particular case, \(a = 1, b =3\).
Points which are of interest are the intersection between \(y\) and the x-axis as well as \(x\) and the \(y\) axis. The former happens exactly when \(y = 0\) while the latter occurs when \(x=0\).
We observe that \(y\) does not intersect the x axis for positive values of \(x\). We also observe that \(x\) intersects the y-axis when \(x=0\). Such intersection can be observed in the ordered pair \((0,3)\).
# Create button and dropdown widget
def rerun_cell( b ):

    display(Javascript('IPython.notebook.execute_cell_range(IPython.notebook.get_selected_index()+1,IPython.notebook.get_selected_index()+2)'))
style = {'description_width': 'initial'}

number_of_cat = 13
dropdown_options = [ str(i+1) for i in range(number_of_cat) ]
dropdown_widget = widgets.Dropdown( options = dropdown_options , value = '3' , description = 'Number of entries' , disabled=False,style=style )

categories_button = widgets.Button(button_style='info',description="Enter", layout=Layout(width='15%', height='30px'))

# Display widgets

#display(dropdown_widget)
#display(categories_button)

#categories_button.on_click( rerun_cell )
Practice Area
Exercise
We will repeat a similar exercise as above, only this time, we will use a different linear relation.
Let us begin by building a simple table.
Answer the questions below to complete a similar table.
Question 1
Knowing that \(y = 2x + 4\), what is the value of \(y\) when \(x = 3\)? In other words, what does \(2(3) + 4\) equal to?
s = {'description_width': 'initial'}

from ipywidgets import interact_manual
def question_q(answer):
    if answer=="Select option":
        print("Click on the correct value of y.")

    elif answer=="10":
        ret="Correct!"
        return ret
    elif answer != "10" or answer != "Select Option":
        ret = "You are close to the answer but need to improve your result.Recall 2(3) = 6. What does 6 + 4 equal to?"
        return ret
answer_q = interact(question_q,answer=widgets.Select(
                    options=["Select option","1",\
                            "10","3",\
                             "0"],
                    value='Select option',
                    description="y value",
                    disabled=False,
                    style=s
))
Question 2
Knowing that \(y = 2x + 4\), what is the value of \(y\) when \(x=0\)?
s = {'description_width': 'initial'}

from ipywidgets import interact_manual
def question_p(answer):
    if answer=="Select option":
        print("Click on the correct value of y.")

    elif answer=="4":
        ret="Correct!"
        return ret
    elif answer != "4" or answer != "Select Option":
        ret = "You are close to the answer but need to improve your result.Recall y = x + 4. What does 0 + 4 equal to?"
        return ret
answer_p = interact(question_p,answer=widgets.Select(
                    options=["Select option","-1",\
                            "10","4",\
                             "0"],
                    value='Select option',
                    description="y value",
                    disabled=False,
                    style=s
))
Question 3
What is the ordered pair obtained when \(x = 2\)?
s = {'description_width': 'initial'}

from ipywidgets import interact_manual
def question_s(answer):
    if answer=="Select option":
        print("Click on the correct ordered pair (x,y)")

    elif answer=="(2,8)":
        ret="Correct!"
        return ret
    elif answer != "(2,8)" or answer != "Select Option":
        ret = "You are close to the answer but need to improve your result.We know y = 8 and x = 2. We also know an ordered pair is of the form (x,y)."
        return ret
answer_s = interact(question_s,answer=widgets.Select(
                    options=["Select option","(2,6)",\
                            "(2,8)","(8,2)",\
                             "(2,-2)"],
                    value='Select option',
                    description="Ordered pair (x,y)",
                    disabled=False,
                    style=s
))
def math_function(relation,x_val):

    y_val = relation["+"](relation["Coef1"]*x_val,relation["Coef2"])

    return y_val


def table_of_values_quad(range_val,relation):

    empty_list = [ '' for i in range(range_val + 1) ]
    category_list = [ i+1 for i in range(range_val + 1) ]

# Set up data input for dataframe

    df_dict = {'Entry Number':category_list,\
           'Values for x': empty_list, \
               'y ='+ str(relation['Coef1']) + "x + " \
               + str(relation['Coef2']):empty_list,\
               'Values for y': empty_list,\
          'Ordered pairs': empty_list}


    feature_list = ['Entry Number','Values for x',\
                    'y ='+ str(relation['Coef1']) \
                    + "x + " + str(relation['Coef2']),\
    'Values for y','Ordered pairs']

    student_df = pd.DataFrame(data = df_dict,columns=feature_list)

    student_df.set_index('Entry Number',inplace=True)


    x_values = np.array(np.arange(range_val+1))
    y_values = math_function(relation,x_values)
    ordered = [(x_values[i],y_values[i]) for i in range(range_val+1)]


    y_equals = ["y = " + str(relation['Coef1']) +"(" + str(x_values[i])  + ")" \
                + "+" + str(relation['Coef2'])
                 for i in range(len(x_values))]

    student_df["Values for y"] = y_values
    student_df["Values for x"] = x_values
    student_df['y ='+ str(relation['Coef1']) + \
               "x + " + str(relation['Coef2'])] = y_equals
    student_df["Ordered pairs"] = ordered

    q_student_df = q.show_grid( student_df , grid_options = grid_features )
    display(q_student_df)
def generate_tab(value):
    if value==True:
        if "Correct!" in str(answer_p.widget.children)\
        and "Correct!" in str(answer_q.widget.children)\
        and "Correct!" in str(answer_s.widget.children):
            relation_ar = {"Coef1":2,"Coef2":4,"+": operator.add}
            table_of_values_quad(4,relation_ar)
        else:
            print("At least one of your answers is not correct. Compare your answers with the table.")
            relation_ar = {"Coef1":2,"Coef2":4,"+": operator.add}
            table_of_values_quad(4,relation_ar)
interact(generate_tab,value = widgets.ToggleButton(
        value=False,
        description='Generate Table',
        disabled=False,
        button_style='info', # 'success', 'info', 'warning', 'danger' or ''
        tooltip='Description',
        icon='check'
    ));
Question 4
Using the information on the table and the widget below, identify and select what ordered pairs belong to the relation
Select one of the four following options. The correct answer will plot all points, the incorrect answer will print a message.
def plot_answer(relation):
    x_values = np.array([0,1,2,3,4])
    y_values = relation["Coef1"]*x_values + relation["Coef2"]

    fig = plt.figure()
    plt.subplots_adjust(left=14, bottom=0.2, right=16, top=1.5,
                wspace=0.1, hspace=0.2)
    ax2 = fig.add_subplot(1, 1, 1)

    ax2.set_xticks(np.arange(-6,11))
    ax2.set_yticks(np.arange(-6,relation["Coef1"]*x_values[-1] + relation["Coef2"]+2))
    ax2.set_xlim(0,5)
    ax2.set_ylim(0,relation["Coef1"]*x_values[-1] + relation["Coef2"]+1)
    ax2.text(x_values[-1] + 1,0.001,"x-axis",fontsize=20)
    ax2.text(0.1,y_values[-1] + 1,"y-axis",fontsize=20)
    ax2.grid(True)
# for i in range(len(x_values)):
#     ax2.text(x_values[i] - 0.5,y_values[i]-0.7,"(" + str(x_values[i]) + "," + str(y_values[i]) + ")")
    points = ax2.scatter(x_values,y_values,color="black",s=60)
    #ax2.scatter(x_value,x_value + 3,color="red",s=120)
    #datacursor(points)

    plt.show()
def choose_points(value):
    if value=="(3,10),(5,14),(0,4)":
        print("Correct!")
        rel = {"Coef1":2,"Coef2":4,"+": operator.add}
        plot_answer(rel)
    else:
        print("Those do not look like the ordered pairs in our table. Try again.")

interact(choose_points,
    value = widgets.RadioButtons(
    options=[
             "(3,11),(5,11),(2,8)",\
            "(0,0),(1,2),(2,2)",\
            "(3,10),(5,14),(0,4)",\
            "(10,10),(10,8),(1,6)"],
#     value='pineapple',
    description='Ordered Pairs:',
    disabled=False,
        style = style
));
Question 5: Conclusions
What can you conclude from the table above? Use the following statements to guide your answer and add any other observations you make.
Statement |
|---|
The relation between \(x\) and \(y\) is linear |
There is an intersection between the y-axis and \(x\) at the ordered pair … |
There is an intersection between the x-axis and \(y\) at the ordered pair … |
emma1_text = widgets.Textarea( value='', placeholder='Write your answer here. Press Record Answer when you finish.', description='', disabled=False , layout=Layout(width='100%', height='75px') )
emma1_button = widgets.Button(button_style='info',description="Record Answer", layout=Layout(width='15%', height='30px'))

display(emma1_text)
display(emma1_button)

emma1_button.on_click( rerun_cell )
emma1_input = emma1_text.value

if(emma1_input != ''):

    emma1_text.close()
    emma1_button.close()
    display(Markdown("### Your answer for Question 6: Conclusions"))
    display(Markdown(emma1_input))
Experiment
In this section you will have an opportunity to explore linear relations parameterized by you, to create their respective tables of values and to plot the ordered pairs. In the end, use what you learned in this notebook to make observations about your findings.
Recall that a linear equation is of the form
Use the widget below to choose new values for \(a,b\).
def choose(a,b):
    print("Equation: " +  str(a) + "x + " + str(b))
    return [a,b]

coeff = interact(choose,a=widgets.IntSlider(value=0,
            min=0,
            max=15,
            step=1,
            description='Value for a',
            disabled=False,
            continuous_update=False,
            orientation='horizontal',
            readout=True,
            readout_format='d',
            style =style)
,b=widgets.IntSlider(value=0,
            min=0,
            max=15,
            step=1,
            description='Value for b',
            disabled=False,
            continuous_update=False,
            orientation='horizontal',
            readout=True,
            readout_format='d',
            style =style));
def rerun_cell( b ):

    display(Javascript('IPython.notebook.execute_cell_range(IPython.notebook.get_selected_index()+1,IPython.notebook.get_selected_index()+3)'))
table_button = widgets.Button(button_style='info',description="Generate Table of Values and Plot", layout=Layout(width='25%', height='30px'))
display(table_button)

table_button.on_click( rerun_cell )
relation_ar = {"Coef1":coeff.widget.kwargs['a'],"Coef2":coeff.widget.kwargs['b'],"+": operator.add}
table_of_values_quad(4,relation_ar)
plot_answer(relation_ar)
Interactive Example: Find the relation from a table of values
What if, instead of knowing what the relation is, we are only given a table of values or a plot?
If we know that the values belong to a linear relation, this along with the values is enough to determine what the relation is.
Consider the table and the plotted ordered pairs below.
def tabulate_to_eq(relation):
    x_values = np.array([0,1,2,3,4])
    y_values = relation["Coef1"]*x_values + relation["Coef2"]
    ordered = [(x_values[i],y_values[i]) for i in range(len(x_values))]


    df_num_rows = len(x_values)
    empty_list = [ '' for i in range(df_num_rows) ]
    category_list = [ i+1 for i in range(df_num_rows) ]


    df_dict_2 = {'Entry Number':category_list,\
           'Values for x': empty_list,'Values for y': empty_list,\
          'Ordered pairs': empty_list}
    feature_list = ['Entry Number','Values for x','Values for y','Ordered pairs']
    student_df_2 = pd.DataFrame(data = df_dict_2,columns=feature_list)

    student_df_2.set_index('Entry Number',inplace=True)
    student_df_2["Values for y"] = y_values
    student_df_2["Values for x"] = x_values
    student_df_2["Ordered pairs"] = ordered

# Set up & display as Qgrid
    q_student_df_2 = q.show_grid( student_df_2 , grid_options = grid_features )
    display(q_student_df_2)
rels = {"Coef1":2,"Coef2":1,"+": operator.add}
tabulate_to_eq(rels)
plot_answer(rels)
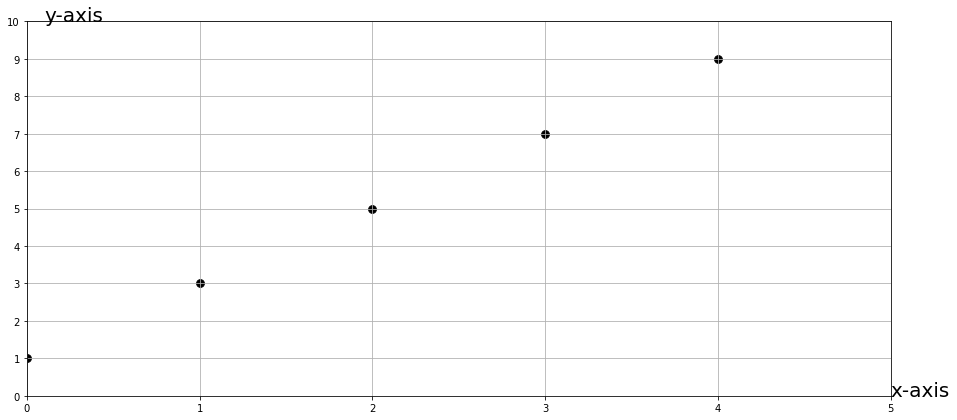
Can you determine what the equation is based on the ordered pairs?
In the questions below we will walk towards the solution.
Observation #1
Using the table or the plot, find what the value of \(y\) is when \(x = 0\). Enter your answer in the box. When you think you have the correct answer, press the Run Interact button.
s = {'description_width': 'initial'}
@interact_manual(answer =widgets.Textarea(
    value=' ',
    placeholder='Type something',
    description='Your Answer:',
    disabled=False,
    style=s))
def get_answer_one(answer):
    if "1" in answer:
        print("Correct!")
    else:
        print("HINT: Look at Entry Number 1 in the table. What is the value for y?")
Observation #2
Recall that a linear relation is of the form
Use this information along with the answer to Observation #1, to deduce the value of \(b\).
Enter your answer in the box below. When you think you have found an answer, press the Run Interact button.
s = {'description_width': 'initial'}
@interact_manual(answer =widgets.Textarea(
    value=' ',
    placeholder='Type something',
    description='Your Answer:',
    disabled=False,
    style=s))
def get_answer_one(answer):
    if "1" in answer:
        print("Correct!")
    else:
        print("HINT: y = ax + b. When x = 0, y = 0 + b = 1. This means that 0 + b = 1. What is the value of b?")
From the observation above, we determined that the value of \(b = 1\), as
and when \(x =0\), we observe \(y = 1\). Via algebraic manipulation, this means that \( 0 +b = 1\) which means \(b = 1\).
We now know our equation is of the form
There is only one loose end. We want to get the value of \(a\).
Observation #3
Observe Entry Number 2. In there we see that the ordered pair is \((1,3)\). This means that if \(x = 1\), then \(y = 3\).
In our equation, this looks as follows:
Which is equivalent to
What is the value of \(a\)?
s = {'description_width': 'initial'}
@interact_manual(answer =widgets.Textarea(
    value=' ',
    placeholder='Type something',
    description='Your Answer:',
    disabled=False,
    style=s))
def get_answer_one(answer):
    if "2" in answer:
        print("Correct!")
    else:
        print("HINT: a + 1 = 3. What value, when added to 1, results in 3? ")
Recap
Observe that all we needed to find the linear equation were the first two entries in the table.
Indeed, we used Entry Number 1, x = 0, y = 1 to determine that b = 1.
We then used this, along with Entry Number 2 x = 1, y = 3, to determine that a = 2.
This yields to the linear equation
Use the widget below to verify that this linear equation generates the adequate table of values.
@interact(x_value=widgets.IntSlider(value=0,
            min=0,
            max=4,
            step=1,
            description='Value for x',
            disabled=False,
            continuous_update=False,
            orientation='horizontal',
            readout=True,
            readout_format='d',
            style =style
))


def verify_points(x_value):
    relation = {"Coef1":2,"Coef2":1,"+": operator.add}
    x_values = np.array([0,1,2,3,4])
    y_values = relation["Coef1"]*x_values + relation["Coef2"]

    fig = plt.figure()
    plt.subplots_adjust(left=14, bottom=0.2, right=16, top=1.5,
                wspace=0.1, hspace=0.2)
    ax1 = fig.add_subplot(1, 2, 1)


    ax1.text(0.1,0.8,"x = " + str(x_value),fontsize=20)
    ax1.text(0.1,0.6,"y = " + str(relation["Coef1"]) + "x + "+ str(relation["Coef2"]),fontsize=20)
    ax1.text(0.1,0.4,"y = 2(" + str(x_value) +  ") + 1 = "  + str(2*x_value)+ " + 1 = " + str(relation["Coef1"]*x_value+ relation["Coef2"]),fontsize=20)
    ax1.text(0.1,0.2,"Ordered pair (" +str(x_value) + "," +  str(relation["Coef1"]*x_value+ relation["Coef2"]) + ")",fontsize=20)
    ax1.set_title("Values for x and y", fontsize=25)
    ax2 = fig.add_subplot(1, 2, 2)
    ax2.set_xticks(np.arange(-6,x_values[-1]+2)),ax2.set_yticks(np.arange(-6,y_values[-1]+2))
    ax2.set_xlim(0,x_values[-1]+1)
    ax2.set_ylim(0,y_values[-1]+1)
    ax1.axis("Off"),ax2.axis("On")
    ax2.axhline(y=0, color='blue')
    ax2.axvline(x=0, color='blue')
    ax2.text(x_values[-1]+1,0.2,"x-axis",fontsize=20)
    ax2.text(0.1,y_values[-1]+1,"y-axis",fontsize=20)
    ax2.grid(True)
# for i in range(len(x_values)):
#     ax2.text(x_values[i] - 0.5,y_values[i]-0.7,"(" + str(x_values[i]) + "," + str(y_values[i]) + ")")
    points = ax2.scatter(x_values,y_values,color="black",s=60)
    ax2.scatter(x_value,relation["Coef1"]*x_value+ relation["Coef2"] ,color="red",s=120)
    #datacursor(points)

    plt.show()
tabulate_to_eq({"Coef1":2,"Coef2":1,"+": operator.add})
Why do you think equations of the form
are called “linear”?
Use the box below to enter your answer.
emma1_text = w.Textarea( value='', placeholder='Write your answer here. Press Record Answer when you finish.', description='', disabled=False , layout=Layout(width='100%', height='75px') )
emma1_button = w.Button(button_style='info',description="Record Answer", layout=Layout(width='15%', height='30px'))

display(emma1_text)
display(emma1_button)

emma1_button.on_click( rerun_cell )
Conclusion
In this notebook we learned what an ordered pair is. We also learned what a table of values is as well as a plane and a coordinate plane. Furthermore, we learned that given a relation between x and y, we can track and represent the relation between x and y via a table of values or a coordinate plane.
We analyzed basic linear relations, tabulated their values and plotted on a coordinate plane. We explored the pairs that intersected the y and x axis and made remarks based on our observations.
